Value Proposition Canvas
Match what customers actually struggle with against what you actually offer - fit you can defend, not adjectives.
On this page
The gist
- →Two sides: Customer Profile (jobs, pains, gains, as they exist WITHOUT you) and Value Map (products, pain relievers, gain creators). Fit = they match.
- →One segment, one canvas. Rank pains and gains by severity x frequency, then design only against the top 3 — a weekly moderate pain beats a yearly severe one.
- →The gaps are the answer: an unmatched pain is competitive exposure, a feature matching no pain is cost to cut.
- →A filled canvas is only problem-solution fit. Price the offer against rupees of pain removed, then name the riskiest assumption and the cheapest test.
The framework at a glance
When to use it
Reach for the VPC whenever a case turns on whether customers will actually want the thing, rather than on arithmetic. Typical triggers: "Our client built a product and adoption is flat - why?"; "Should we launch this new offering for segment X?"; "Our NPS is fine but churn is high"; "We are entering a market where three incumbents already exist - how do we differentiate?"; "Design the product for this underserved customer"; "Our sales team says the product is great but the pitch is not landing." It is also the right tool when an interviewer hands you a rich customer description - a persona, a day-in-the-life, verbatim complaints - and expects you to use it rather than reciting a generic profitability tree. In a market-entry or GTM case, use the VPC as the customer sub-branch: after you have sized the market, the VPC is how you prove the client can win it. Do not reach for it when the question is purely financial (falling margins, cost structure, make-versus-buy) or purely about competitive structure (use profitability or Porter's Five Forces instead).
What it is
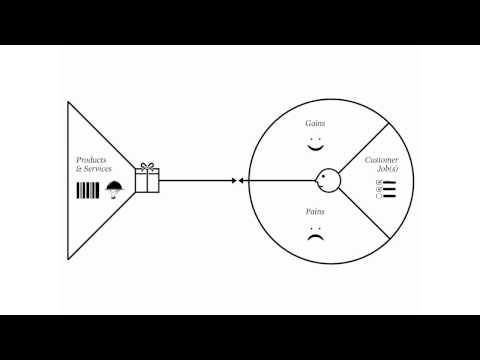
The Value Proposition Canvas (VPC) is a two-sided diagram created by Alex Osterwalder and the Strategyzer team as a zoom-in on the "Value Propositions" and "Customer Segments" boxes of the Business Model Canvas. The right side is a circle called the Customer Profile. It has three compartments: Customer Jobs (what the customer is trying to get done - functional, social and emotional), Pains (the bad outcomes, risks, obstacles and costs they hit while doing those jobs), and Gains (the outcomes and benefits they want, from bare-minimum requirements to delightful surprises). Crucially, this side describes the customer as they exist today, with or without you. Nothing about your product belongs here.
Keep reading ↓Show less ↑
The left side is a square called the Value Map, and it describes your offer. It also has three compartments: Products and Services (the plain list of what you sell or provide), Pain Relievers (how specifically each item kills, reduces or removes a named pain), and Gain Creators (how specifically it produces a named gain). The square-into-circle shape is the whole point: your offer only counts if it slots into a real customer profile. The canvas is deliberately built so that any pain reliever with no matching pain, or any pain with no matching reliever, shows up as a visible gap on the page.
When the two sides line up, you have Fit. Strategyzer distinguishes three levels. Problem-solution fit is fit on paper: you have evidence that the jobs, pains and gains are real, and your value map plausibly addresses the important ones. Product-market fit is fit in the market: customers actually adopt, use, pay and stay. Business model fit is fit in your P&L: the value proposition can be delivered at a cost and price that make money, which is where it connects back to the Business Model Canvas. The VPC is a thinking-and-evidence tool, not a sizing tool - it tells you whether an offer deserves to exist and what to test next, not how big the market is. Pair it with TAM-SAM-SOM or a pricing framework when you need numbers.
How to apply it, step by step
- 1
Pick one segment and name it precisely
The canvas breaks the moment you draw it for "customers" in general, because a pain that is severe for one segment is invisible to another. Name a segment you could point at in the real world: "kirana owners in tier-2 cities doing 40k to 80k rupees of monthly sales", not "small retailers". If the case has multiple segments, say out loud that you will build separate canvases and start with the one with the most revenue at stake. One canvas equals one segment equals one value proposition.
- 2
List the customer's jobs before mentioning any product
Ask what the customer is trying to get done, in their words, on a normal day. Split into functional jobs (restock inventory before the weekend rush), social jobs (be seen as a shop that never runs out), emotional jobs (sleep without worrying about a bounced payment) and supporting jobs (compare supplier prices, keep a ledger). Add context: how often, at what moment, under what constraint. The common trap is writing your product's benefits as jobs - "needs a credit app" is not a job, "pay the distributor on delivery day" is.
- 3
Extract pains, and separate obstacle from risk from cost
For each job, ask what goes wrong. Pains come in three flavours: undesired outcomes and problems (stock-outs on the two highest-margin SKUs), obstacles that stop them even starting (no documented income, so no bank will lend), and risks they fear (a moneylender at 4 percent a month spiralling into debt). Write pains as concretely and measurably as you can - "loses roughly 8 to 10 percent of monthly sales to stock-outs" beats "cash flow problems", because severity is what you rank on next.
- 4
List gains, including the ones they already assume
Gains are not the mirror image of pains. Use the four tiers: required gains (the money must arrive before the delivery van does), expected gains (an app in Hindi, not only English), desired gains (a limit that grows automatically as sales grow), and unexpected gains (transaction history becoming a track record that unlocks a bank loan later). The required and expected tiers are table stakes - miss them and nothing else matters. The desired and unexpected tiers are where differentiation actually lives.
- 5
Rank both pains and gains by severity and frequency
This is the step candidates skip and interviewers reward. Sort pains from extreme to moderate and gains from essential to nice-to-have, and say why. A simple two-factor rank works: how badly does it hurt, and how often does it happen. A moderate pain felt weekly usually beats a severe pain felt once a year. From here on you design only against the top three of each - everything below the line is noise you have explicitly chosen to ignore.
- 6
Build the value map as a one-to-one match, not a feature list
Write your Products and Services first (the plain list: a 30-day revolving credit line, a restocking app, same-day disbursal). Then, for each top-ranked pain, write the specific pain reliever that kills it and say by how much. Do the same for the top gains with gain creators. Every reliever must point at a named pain; if it points at nothing, it is a feature you built for yourself. You do not need to address every pain - great value propositions address a few painful ones extremely well.
- 7
Test fit out loud and mark the gaps
Walk the two sides together and score each match: does the reliever remove the pain, reduce it, or merely acknowledge it? Then name the two failure modes explicitly. Unmatched pains are your competitive exposure - the opening through which a rival takes the customer. Unmatched relievers are wasted cost - features to cut, which often becomes your margin recommendation. Then step up a level: is this problem-solution fit only, or do you have adoption and repeat-usage evidence, meaning product-market fit?
- 8
Convert fit into evidence, pricing and a next test
Finish with the business answer, not the diagram. Which pain is severe enough that the customer will pay to remove it, and what is that pain worth to them per month? That number anchors your price, and the gap between it and your cost to serve is business model fit. Then name the single riskiest assumption on the canvas and the cheapest test for it - 20 customer interviews, a concierge pilot in one cluster of 50 shops, a fake-door landing page. A VPC that ends without a test is decoration.
Worked example
A Bengaluru fintech backed by an NBFC wants to launch a 30-day working-capital credit line for kirana store owners in tier-2 cities like Nashik, Rajkot and Warangal. Target customer: an owner-operated grocery shop doing 60,000 to 80,000 rupees of monthly sales, buying from two or three distributors and one wholesale mandi. The interviewer asks: is there a real value proposition here, and what should we build first?
Segment
Narrow immediately. Not "MSMEs", not even "kiranas". Target: single-outlet kirana owners, 60k to 80k rupees monthly sales, tier-2 cities, already collecting at least a third of sales via UPI, no existing formal business loan. The UPI condition matters because it is the only digital income trail we can underwrite against, and it cuts the segment down to something we can actually serve.
Customer Jobs
Functional: restock 30 to 50 fast-moving SKUs every week, pay the distributor cash-on-delivery on the day the van arrives, reconcile the day's cash. Social: be the shop in the lane that never says 'out of stock', and be treated by the distributor as a serious buyer rather than a small one. Emotional: avoid the shame and fear of borrowing from a local moneylender or a relative. Supporting: track which customers owe him udhaar (informal credit) and chase them.
Pains, ranked
1) Cash timing mismatch - he sells partly on udhaar and collects late, but distributors demand cash on delivery, so roughly 8 to 10 percent of potential monthly sales are lost to stock-outs of exactly the high-velocity SKUs. 2) No access to formal credit - no audited books and no ITR, so banks reject him, and the informal alternative costs 3 to 5 percent per month. 3) Festival and salary-week spikes need 2x inventory he cannot pre-fund. 4) Paperwork and branch visits cost him half a shop-day, which is direct lost revenue. Ranked on money-at-stake times frequency, pain 1 is the killer because it recurs every week.
Gains, tiered
Required: the money must reach the distributor before the van arrives, same day, no exception. Expected: a Hindi or Marathi interface, and total cost shown as one comparable number he can hold against the moneylender's monthly rate. Desired: a limit that grows automatically as his UPI collections grow, so he is not re-applying every quarter. Unexpected: a repayment record that becomes a credit history he can take to a bank for a 5 lakh rupee shop-expansion loan in two years.
Value Map
Products and services: a 30-day revolving line of 25k to 100k rupees disbursed directly to the distributor, a mobile app, and auto-repayment from UPI settlements. Pain relievers: same-day disbursal to the distributor removes the cash-timing mismatch and should recover most of the 8 to 10 percent stock-out loss; underwriting on six months of UPI data instead of ITR removes the documentation obstacle; a flat 1.5 to 2 percent per month, displayed in rupees rather than APR, is roughly half the moneylender's cost and comparable at a glance; a pre-approved festival top-up handles the spike. Gain creators: automatic limit increases tied to observed collections, and a downloadable repayment record positioned as the path to a bank loan.
Fit test
Matched: pains 1, 2 and 3 are directly addressed, and the required and expected gains are met. Unmatched pain: collecting udhaar from his own customers - we do nothing there, and that is our exposure, because a rival bundling a khata-and-collection tool could own the daily relationship. Unmatched feature: the in-app spend analytics dashboard the team wanted to build maps to no ranked pain - cut it, it is cost with no fit. Status: this is problem-solution fit only. We have logic, not evidence.
Evidence and monetisation
The riskiest assumption is not demand, it is repayment behaviour on an unsecured 30-day line to a thin-file borrower. Cheapest test: a 90-day pilot with 200 shops across two Nashik clusters, disbursing only through two partner distributors so funds cannot be diverted, measuring 30-day collection rate and repeat-draw rate. Pricing anchor: recovering 8 percent of 70,000 rupees is about 5,600 rupees of extra monthly sales, roughly 900 to 1,100 rupees of extra margin at kirana margins - so a 400 to 600 rupee monthly fee on a 30k drawdown is clearly worth it to him and still half the moneylender's price. Business model fit then hinges on credit losses staying under roughly 3 percent.
Recommendation
Launch, but narrowly: distributor-linked disbursal only, one product (the 30-day line), two cities, 200 shops, with repeat-draw rate instrumented as the real fit signal. Kill the analytics dashboard. Put the udhaar-collection gap on the roadmap as the defensive move once repayment data is in.
Takeaway: The canvas did work that an intuition-led answer would have missed: it forced a ranked pain (weekly cash timing, not the vague 'lack of credit'), exposed an unmatched pain that is the real competitive risk, cut a feature with no fit, and produced a price anchored in rupees of pain removed rather than in what competitors charge.
More worked examples
Worked example: Netflix launching its ad-supported tier (2022)+
Netflix has just reported its first subscriber declines in over a decade (roughly 200k lost in Q1 2022 and about 970k in Q2, as publicly reported), after years of insisting it would never run ads. Management has also said publicly that around 100 million households watch on a borrowed password. The strategy question: is there a genuine value proposition behind a cheaper, ad-supported plan, or is it just a price cut that will cannibalise the paying base? Build the Value Proposition Canvas for the viewer Netflix is actually trying to reach, then check the money.
Ad tier price, US launch (approx)
$6.99/mo
Standard ad-free tier then (approx)
$15.49/mo
Ad load vs linear TV (approx)
4-5 min/hr vs ~18
Password-sharing households cited
~100M
Q2 2022 net subscriber loss (reported)
~970k
Pick one segment and name it precisely
Not "Netflix viewers". The segment is the price-constrained household that already pays for two or three streaming services, watches Netflix perhaps eight to ten hours a month, and cycles subscriptions on and off around specific shows - plus the borrowed-password household inside that same income band. I explicitly exclude the heavy four-screen 4K family, because their pain was never price and drawing them into this canvas would produce a plan that just cannibalises revenue. One further discipline: this product has two customers, the viewer and the advertiser, so I will build the viewer canvas first and a second, separate canvas for the advertiser before I claim fit.
List the customer's jobs before mentioning any product
Functional job: fill one to two hours of evening downtime with something worth watching, and keep the total household entertainment line item inside a mental budget of roughly forty to fifty dollars a month across all services. Social job: be able to watch the show the group chat is discussing this week, so as not to be the person who has to mute the thread. Emotional job: not feel foolish paying fifteen dollars for a service used four nights a month. Supporting job: actively manage the stack - decide each month which service to pause and which to resubscribe to. Note that nothing here mentions ads or tiers; that comes later.
Extract pains, and rank them by severity times frequency
Pain 1: price relative to actual usage. At roughly $15.49 for eight to ten hours of viewing, the household is paying close to $1.70 an hour and knows it - this recurs every single billing cycle and is the literal trigger of the cancel click. Pain 2: stack creep - the combined bill across three or four services has quietly passed what cable cost, which was the original reason they cut the cord. Pain 3: the friction and mild embarrassment of cancel-and-resubscribe cycling. Pain 4: ad aversion. The ranking is the whole insight: for this segment, ad aversion is moderate, not extreme - they already tolerate YouTube pre-rolls and grew up on broadcast - while price pain is severe and monthly. That inversion is precisely what makes an ad tier viable for this segment and would be wrong for the premium segment I excluded.
List gains, including the ones they already assume
Required gains (miss these and nothing else matters): the shows they actually came for must be there, and their profiles, watchlist and devices must carry over unchanged. Expected gains: HD picture, no per-episode paywalls, works on the living-room TV not just the phone. Desired gain: a price under the psychological ten-dollar line, which is what moves Netflix off the monthly cancel-candidate list entirely. Unexpected gain: an ad load light enough - four to five minutes an hour against roughly eighteen on linear television - that the experience reads as a better deal than TV rather than as a downgrade from Netflix. The required tier is table stakes; the last one is where the differentiation against Hulu's heavier legacy ad load actually sits.
Build the value map as a one-to-one match
Products and services: Standard with Ads at about $6.99, roughly four to five minutes of advertising per hour, the same recommendation engine, profiles and continue-watching. Pain relievers, matched one to one: the price cuts the monthly outgo by about fifty-five percent, which moves Netflix from above the household's cancel threshold to below it - that kills ranked pain 1, the severe and recurring one. Keeping the ad load at roughly a quarter of broadcast keeps ranked pain 4 inside the moderate band where it was ranked, rather than trading a severe price pain for a severe experience pain. Gain creator: the household stays inside the ecosystem with profiles intact, which preserves an upgrade path when income or usage rises. Note what is not relieved: pain 2, the total stack bill, gets nothing - Netflix can only shrink its own line item.
Test fit out loud and mark the gaps
Unmatched required gains at launch, and these matter most because required gains are non-negotiable: a slice of the catalogue was missing because ad-supported rights had not been cleared with all studios, downloads were unavailable, and resolution was capped below the ad-free plan. The canvas predicts exactly what happened - adoption stays soft until those gaps close, and Netflix subsequently added downloads, raised resolution to 1080p and narrowed the licensing holes. Unmatched pain: stack creep is our competitive exposure, and it explains why telecom and multi-service bundles became the counter-move - a bundle attacks the pain Netflix alone cannot reach. Status honestly stated: at launch this was problem-solution fit, not product-market fit; fit became real only when ad-tier plans became the majority of new sign-ups in the markets where they were offered.
Second canvas, then business model fit and the decision
The advertiser is a separate customer with separate jobs: reach a specific audience at scale, verify delivery with third-party measurement, and stay brand-safe. Their severe pain at launch was thin reach and Netflix-only measurement, which is why guaranteed-impression pricing was hard to hold and why third-party measurement partnerships were the first fix - that is a pain reliever aimed at a named advertiser pain, not a feature. Business model fit for the viewer side: the tier only works if subscription plus advertising revenue per ad-tier user approaches the roughly $8.50 gap to the ad-free plan, which at four to five minutes an hour and ordinary connected-TV CPMs is reachable for a moderately heavy viewer but not for a light one. That produces the real risk to manage: the tier is accretive when it converts churners and password borrowers, and dilutive when a heavy ad-free viewer downgrades - so the canvas tells you to guard the ad-free segment (paid sharing, ad-free price integrity) at the same time as you launch.
Takeaway: Ranking pains for one narrowly defined segment turned a seemingly contradictory strategy into an obvious one: for the price-constrained cycler, price pain is severe and monthly while ad pain is only moderate, so trading the second for the first is a gain, not a compromise - but only for that segment, which is why paid sharing and ad-free price protection had to launch alongside. The unmatched boxes did the rest of the work: missing downloads, catalogue and resolution were unmet required gains that predicted slow early adoption, unmet stack-creep pain explained the bundling counter-move, and the advertiser's measurement pain identified the second product to build.
Worked example: an EV two-wheeler maker designing an offer for gig delivery riders in Bengaluru+
An Indian electric two-wheeler OEM has strong showroom sales to urban commuters but wants to enter the gig-delivery segment - full-time Swiggy, Zomato, Blinkit and Zepto riders. Their first attempt failed: they simply offered the commuter scooter at a small discount through a fleet tie-up and saw single-digit conversion despite a running cost that is a fraction of petrol. The interviewer asks: is there a real value proposition for the rider, and what exactly should we sell him? Build the canvas for the rider before touching the product.
Rider distance (approx)
110 km/day, ~2,860 km/mo
Petrol all-in cost/km (approx)
~Rs 2.85
EV subscription all-in cost/km (approx)
~Rs 1.60
Monthly saving to rider (approx)
~Rs 3,575
Lost earnings per peak hour off-road (approx)
Rs 60-80
Pick one segment and name it precisely
Target: the full-time single-platform gig rider in a metro like Bengaluru or Hyderabad, riding roughly 100 to 120 km a day for 26 days, grossing about Rs 22,000 to 28,000 a month before fuel, on a 110cc petrol scooter he owns or rents, with no formal salary slip and a thin credit file. I deliberately exclude two adjacent groups. Part-timers under 40 km a day are excluded because the fuel saving is too small to cover any subscription. Fleet operators who lease 200 bikes to riders are excluded because they are a different buyer with different jobs entirely - that is a second canvas, and the first attempt failed partly because the OEM sold through fleets while designing for nobody. One segment, one canvas.
List the rider's jobs before mentioning any product
Functional jobs: complete the maximum number of drops inside the platform's delivery-time SLA, stay on the road through the two revenue peaks (roughly 12 to 3 and 7 to 11), and refuel or recharge without touching those windows. Social job: stay in the top rating and incentive slab, because slab position is worth more than any single delivery - being visibly reliable is income, not vanity. Emotional job: not spend the shift afraid of a breakdown or a dead battery in the middle of a surge. Supporting jobs: arrange financing without a salary slip, get the vehicle serviced without losing a working day, and use the same bike for family transport on his off day. Note the last one - it looks minor here and turns out to decide the case.
Extract pains and rank them by rupees times frequency
Pain 1: fuel. At roughly Rs 2.50 a km for fuel plus about Rs 0.35 for maintenance on 2,860 km, running cost is about Rs 8,150 a month, or a quarter to a third of gross earnings - daily, unavoidable, and the largest single rupee number in his life. Pain 2: downtime. Every hour off-road in a peak costs Rs 60 to 80 in foregone earnings, so a three to four hour mid-day charge is not an inconvenience, it is roughly Rs 200 to 300 of lost income plus a slab risk - this is the pain that kills naive EV pitches, because a cheap-per-km vehicle that must stop mid-shift is economically worse than an expensive-per-km one that never stops. Pain 3: upfront cost and financing - an EV at Rs 1.1 to 1.3 lakh against a petrol scooter at Rs 80,000 to 85,000, with NBFCs rejecting thin-file riders or pricing at 24 percent plus. Pain 4: a two-day workshop turnaround costs him Rs 1,500 to 2,000 in lost earnings. Pain 5: uncertainty about battery degradation and resale value at year three - severe if it happens, but distant and one-off, so it ranks last. Ranked on money times frequency, the order is 1, 2, 3, 4, 5, and the first attempt failed because it solved only pain 1.
List gains in tiers, separating table stakes from differentiation
Required gains: 110-plus km of usable range in stop-start Bengaluru traffic in May heat with a loaded delivery box, and no interruption inside a revenue peak. Miss this and nothing else on the page matters. Expected gains: an energy point within two to three kilometres of the high-density order clusters he actually works - HSR, Koramangala, Indiranagar - not on a highway, and one visible monthly number instead of a tariff he has to compute. Desired gain: total monthly outgo, EMI plus energy plus service, lower than today's fuel bill from month one - he needs to be cash-flow positive on day one, because a rider with no savings cannot fund an eighteen-month payback no matter how good the IRR looks on our slide. Unexpected gain: a clean repayment record tied to platform payouts that becomes his first formal credit history, which is the thing that later gets him a house or a second vehicle. That last one is differentiation; the first two are table stakes.
Build the value map as a one-to-one match
Products and services: not a scooter. A monthly subscription bundling vehicle, battery-swap access, service and insurance, with the battery owned by us (battery-as-a-service) and repayment auto-deducted from the platform payout. Matching relievers, one to one. Against pain 1: all-in cost falls to roughly Rs 1.60 a km against Rs 2.85, saving about Rs 3,575 a month on 2,860 km. Against pain 2, the ranked killer: a two-minute battery swap instead of a three to four hour charge removes the pain rather than reducing it, and stations sited on order-density heatmaps rather than main roads keep the detour inside two kilometres. Against pain 3: battery-as-a-service takes the acquisition price from Rs 1.2 lakh to near zero upfront, and payout-linked deduction replaces the credit file we do not have - underwriting on observed earnings, not on documents. Against pain 4: a 90-minute service SLA at the swap hub, done between peaks rather than across two days. Gain creator: a downloadable repayment record positioned as his credit history.
Test fit out loud and mark both kinds of gap
Unmatched pain, and it is the one that will lose us riders: weekend and family use. The scooter is also the household vehicle - a rider who cannot take his family 60 km to a wedding because there is no swap point on that road will not switch, however good the weekday economics are. Worse, a subscription bike is emotionally not his, which collides with an ownership job we never listed on the product side. Both are competitive exposure and a roadmap item: a highway swap corridor, a weekend range pack, or an ownership-transfer option at month 36. Unmatched feature: the connected telematics dashboard with ride analytics that the product team is proudest of maps to no ranked rider pain at all - it maps neatly to a fleet operator's pains, which is a different canvas and a different buyer, so for this offer it is cost with no fit and should be cut from the rider price. Status: this is problem-solution fit only. We have arithmetic, not adoption.
Convert fit into pricing, cost to serve and one test
Price against pain removed, not against a petrol scooter's EMI. The pain we remove is about Rs 3,575 a month of fuel plus roughly Rs 800 to 1,200 of recovered downtime, so call it Rs 4,400 to 4,800 of monthly value created. Price the subscription at Rs 2,800 to 3,200 all-in: the rider is Rs 1,200 to 1,600 better off every month with zero upfront, which satisfies the day-one cash-flow gain, and we keep enough margin to matter. Business model fit then turns entirely on swap-station economics, not on rider demand - at roughly Rs 8 to 10 lakh of capex per station, a station needs something like 35 to 40 subscribed riders in its catchment to work, which means station density inside one cluster beats presence in five cities. So the riskiest assumption is utilisation per station, and the cheapest test is a single-cluster pilot: six stations across HSR and Koramangala, 250 riders, 90 days, instrumented on swaps per station per day, peak-hour uptime and 30-day retention - not on units sold.
Takeaway: The canvas explained the failed first attempt in one line: the OEM solved the biggest pain (fuel) and ignored the second-ranked one (mid-shift downtime), and for a rider paid by the delivery, an interrupted shift wipes out the saving. Ranking by rupees times frequency reframed the product from a discounted scooter into a swap-plus-subscription service with payout-linked underwriting; the unmatched boxes then produced two clean decisions - cut the telematics dashboard from the rider offer and put weekend and intercity range on the roadmap as the defensive move - and the pricing anchor came from rupees of pain removed, which is also what turned the pilot metric from units sold into swaps per station per day.
Common pitfalls
- •Writing your product into the customer profile. "Needs an app to manage inventory" is not a customer job, it is your solution smuggled onto the wrong side of the page. Jobs, pains and gains must be true even if your company never existed.
- •Drawing one canvas for "customers". A pain that is extreme for a tier-2 kirana owner is irrelevant to a modern-trade supermarket. One segment, one canvas, one value proposition - if you cannot name the segment in a single sentence, you are not ready to fill it in.
- •Listing without ranking. Twenty unranked pains is a data dump, not analysis. The insight is which two or three pains are severe and frequent enough that someone would pay to remove them, with everything else visibly deprioritised.
- •Treating gains as the opposite of pains. Removing a pain gets you to zero, creating a gain gets you above it. "Not being rejected by a bank" is a pain relieved; "a credit history that unlocks a bigger loan later" is a gain created, and that is usually the differentiator.
- •Declaring product-market fit off a whiteboard. A completed canvas is a set of hypotheses, and at best it is problem-solution fit. Fit becomes real only with adoption, repeat usage and willingness to pay - say which level you are claiming and on what evidence.
- •Ignoring the unmatched boxes and stopping at the diagram. The gaps carry the value: an unaddressed pain is where a competitor gets in, and a feature matching no pain is cost you can strip out. If your recommendation is "we have good fit", you have described a picture instead of making a decision.
Interview tips
- •Say the shape out loud when you introduce it: "I'll profile the customer first - jobs, pains, gains - without mentioning our product, then map our offer onto it and look for gaps." That signals discipline and buys you the two minutes you need to build the profile.
- •Never claim you cannot proceed without data. Propose the specific customer you would interview and the three questions you would ask, then reason from a stated persona - "assume a 60k-a-month single-outlet kirana owner" - and label it clearly as an assumption you would validate.
- •Rank in front of the interviewer and justify the ranking on money and frequency. "This pain recurs weekly and costs him about 8 percent of sales, so it outranks the annual one" is the sentence that separates a strong candidate from a list-maker.
- •Use the gaps as your recommendation engine. Unmatched pain equals competitive risk plus roadmap item; unmatched feature equals cut it and save the cost. Two clean recommendations fall straight out of the diagram if you look for them.
- •Bridge to numbers before you finish. Quantify the top pain in rupees per month, use that to anchor price, and set it against cost to serve. Product cases are still business cases - the interviewer wants a decision with an economic argument behind it.
- •Know its neighbours so you can pick the right zoom level under pressure: JTBD is the deeper theory behind the jobs box, STP decides which segment to draw it for, Lean Canvas covers the whole startup model, and the Business Model Canvas is the layer above.
Test yourself
Best video explainers

Strategyzer's Value Proposition Canvas Explained
Strategyzer
The canvas straight from its creators - the cleanest authoritative walk through both sides and what fit actually means.
Value Proposition Canvas Explained
Strategyzer
Short official overview - the fastest way to get the shape of the tool into your head before a mock case.

Value Proposition Canvas by Strategyzer.com explained through the Uber Example🚘
Railsware Product Studio
Fills in a complete canvas for a real product, which is exactly the live exercise an interviewer will make you do.

Value Props: Create a Product People Will Actually Buy
Harvard Innovation Labs
A rigorous session on separating what customers say they want from what they will pay for - the discipline behind the pains box.
Value Proposition and Customer Segments: Crash Course Business - Entrepreneurship #3
CrashCourse
Excellent beginner grounding in why the value proposition and the customer segment have to be defined together.
Go deeper
The Value Proposition Canvas (official page and free template)
Strategyzer
The source of the framework, with the official downloadable canvas and the definitions of jobs, pains, gains and the three levels of fit.
How to Create an Effective Value Proposition
Harvard Business School Online
Free HBS Online explainer connecting the canvas to jobs-to-be-done and to how a value proposition statement is actually written.
Business Model Canvas research guide: Value Proposition
Washington University in St. Louis Libraries
University research guide showing where the value proposition sits inside the wider Business Model Canvas, with curated further reading.
The Value Proposition Canvas (printable worksheet)
University of Pittsburgh Innovation Institute
A free one-page PDF with prompts inside each box - print it and fill it in while practising product cases.
The value proposition canvas
OpenLearn, The Open University
A free structured university course module that teaches the canvas step by step with exercises rather than just defining it.
Now use it on a real case
Reading a framework isn't the same as applying it under pressure. Practise with an AI interviewer that pushes back.
Practise a case free