BCG Growth-Share Matrix
Sort a company's businesses into four boxes on growth and share, then decide where the cash goes.
On this page
The gist
- →Plot each business on market growth (cut-off ~10%) vs relative share (your share / leader's share, cut-off 1.0x) — it is a capital allocation tool.
- →Four boxes: Stars (invest to defend), Cash Cows (milk to fund the rest), Question Marks (back fully or exit — never fund all a little), Dogs (divest unless linked).
- →Read the cash flow, not the labels: do the cows generate enough to fund the stars and question marks? Size bubbles by revenue or capital employed.
- →It is a snapshot — overlay 3-year arrows and end with a funded, sequenced plan: how much money moves where, what gets sold, and the trigger to reverse.
The framework at a glance
When to use it
Reach for this when a case gives you a company with multiple businesses, brands, SKUs or geographies and asks a resource-allocation question. The tells are prompts like: a conglomerate wants to rationalise its portfolio, a CEO asks which businesses to exit, a client has limited capex and too many projects, a promoter family wants to know what to sell before an IPO, a private equity fund is deciding what to do with a diversified acquisition, or an FMCG company has 40 SKUs and wants to cut to 15. In India this shows up constantly with the diversified groups: Tata, Aditya Birla, ITC, Reliance, Godrej, Mahindra. Do not use it for a single-product profitability case, a market entry case, or a pricing case; those need the profitability tree, market entry and pricing frameworks. Also skip it when the businesses are deeply interlinked and share customers, brand or distribution, because the matrix assumes each unit stands alone.
What it is
The BCG Growth-Share Matrix is a portfolio tool. It was created inside Boston Consulting Group in the late 1960s and made famous by founder Bruce Henderson in a 1970 essay called The Product Portfolio. Its job is narrow and useful: when one company owns several businesses or product lines, it tells you which ones to feed cash to, which ones to milk for cash, and which ones to get out of. It is a capital allocation tool first and a marketing tool second.
Keep reading ↓Show less ↑
It works by plotting every business unit on two axes. The vertical axis is market growth rate, which stands in for how attractive the market is and, more importantly, how much cash the business will swallow. Fast-growing markets are hungry: you have to build capacity, hire salespeople and buy shelf space just to stand still. The classic cut-off is around 10 percent annual growth, though in practice you set it at whatever separates your fast markets from your slow ones. The horizontal axis is relative market share, which is your share divided by the largest competitor's share, not your raw percentage. If you have 20 percent and the leader has 60 percent, your relative share is 0.33x and you are weak. If you have 30 percent and the number two has 15 percent, your relative share is 2.0x and you are strong. The cut-off is 1.0x, meaning market leadership. Relative share is used because of the experience curve logic underneath the whole framework: the biggest player has produced the most units, has the lowest unit cost, and therefore earns the most cash at any given price.
Cross the two axes and you get four boxes. Stars are high growth and high share: they generate a lot of cash but consume just as much defending their lead, so they are roughly cash-neutral and you keep investing. Cash Cows are low growth and high share: mature market leaders that throw off far more cash than they need, and that cash funds the rest of the portfolio. Question Marks are high growth and low share: real opportunity but no position yet, so they burn cash and demand a decision. Dogs are low growth and low share: cash-neutral at best, and mostly a drain on management attention. The intended life cycle is Question Mark to Star to Cash Cow, funded along the way by the cows you already have, with Dogs pruned out. A healthy portfolio is balanced: enough cows to pay for enough question marks to produce the next generation of stars. A portfolio that is all cows is dying quietly; a portfolio that is all question marks will run out of money.
How to apply it, step by step
- 1
Define the unit of analysis before anything else
Decide what a box on the grid actually is: a business division, a brand, a product line, a geography, or a customer segment. Get this wrong and every conclusion is wrong. In an interview, say it out loud and check with the interviewer, for example: I will treat each of the six divisions as one unit; should I go finer and split FMCG into foods and personal care? A unit should be something the company could realistically fund, sell or shut down on its own.
- 2
Measure market growth for each unit
Use the growth rate of the market the unit competes in, not the unit's own revenue growth. A business growing 5 percent in a market growing 20 percent is a Question Mark losing ground, not a solid performer. Take a three to five year forward view where you can. Then set the horizontal dividing line deliberately: 10 percent is the textbook default, but the honest version is to set it at the level that separates cash-hungry markets from self-funding ones, or at the company's cost of capital and growth ambition.
- 3
Compute relative market share, not absolute share
For each unit, divide its market share by the largest competitor's share. Above 1.0x means you are the leader; below means you are not. Ten percent share sounds identical in two markets, but 10 percent against a leader with 12 percent is a very different business from 10 percent against a leader with 55 percent. If share data is unavailable in the case, proxy it with revenue versus the named biggest rival, or ask the interviewer for a rough ranking.
- 4
Plot the units with bubbles sized by revenue
Draw the 2x2 and place each unit, sizing the circle by revenue or by capital employed. This one habit turns the matrix from a sorting exercise into an insight machine: a large Dog is a completely different problem from a tiny one, and a small Star may be irrelevant to group results no matter how attractive it looks. Sizing by capital employed instead of revenue is often sharper because it exposes where the money is actually trapped.
- 5
Read the cash flow, not just the labels
Now translate positions into money. Add up cash generated by the Cash Cows and cash consumed by the Stars and Question Marks. The core question is whether the portfolio funds itself or needs external capital. If the cows cannot cover the question marks, you must either cut question marks, sell a Dog, or raise money. This step is what separates a candidate who has memorised four labels from one who can actually allocate capital.
- 6
Assign a strategy to each quadrant
Build: put money into selected Question Marks that have a credible route to leadership. Hold: keep investing in Stars to defend share while the market is still growing. Harvest: take cash out of Cash Cows and weak Question Marks without starving the cows to death. Divest: exit Dogs and the Question Marks you chose not to back. Note that the decision inside Question Marks is binary. Funding all of them lightly is the classic way to lose money in every one of them.
- 7
Stress-test the classification before committing
Challenge your own boxes. Does a Dog stay because it supplies a Star, protects a distribution channel, or blocks a competitor? Is a Cash Cow actually a Dog in two years because the market is being disrupted? Is a Question Mark cheap to test with a pilot rather than a full commitment? The matrix is a snapshot in time, so overlay the direction of travel: draw an arrow showing where each unit will be in three years.
- 8
Synthesise into a funded, sequenced recommendation
End with specifics, not adjectives. Name which units to exit and the rough proceeds, which one or two Question Marks get funded and with how much, what the Cash Cows must deliver to pay for it, and the milestone at which you would reverse the call. Add the risks: execution capacity, employee impact of an exit, and whether selling a business damages the brand or a shared supply chain.
Worked example
Nirvaan Group, a Pune-based diversified Indian company with revenue of 8,400 crore, has five businesses and a new CEO. The board has approved only 600 crore of growth capex for next year and wants to know where it should go and what should be sold. The businesses are: Auto Components (2,900 crore revenue, market growing 4 percent, Nirvaan share 22 percent against the largest rival at 20 percent), Packaged Snacks (1,100 crore, market growing 18 percent, share 6 percent against leader at 34 percent), Cement in one state (2,600 crore, market growing 5 percent, share 9 percent against leader at 31 percent), Solar EPC (900 crore, market growing 27 percent, share 11 percent against the next largest at 10 percent), and a legacy Textile Mill (900 crore, market growing 1 percent, share 3 percent against leader at 18 percent).
Set the axes and the cut-offs
Growth cut-off is set at 10 percent, which cleanly separates Snacks at 18 percent and Solar at 27 percent from Auto at 4 percent, Cement at 5 percent and Textiles at 1 percent. Share cut-off is a relative share of 1.0x. Computing relative share: Auto 22/20 = 1.1x, Snacks 6/34 = 0.18x, Cement 9/31 = 0.29x, Solar 11/10 = 1.1x, Textiles 3/18 = 0.17x.
Place the five businesses
Solar EPC is the only Star: high growth at 27 percent and leadership at 1.1x. Auto Components is the Cash Cow: slow market, clear leadership, and the largest revenue base at 2,900 crore. Packaged Snacks is a Question Mark: an attractive 18 percent market but a distant number four at 0.18x. Cement is a Dog with a very big bubble, 2,600 crore of revenue and capital stuck in a slow market where Nirvaan is a sub-scale regional player at 0.29x. Textiles is a small, clear Dog.
Read the cash flow across the portfolio
Auto throws off cash but its market is growing only 4 percent, so the cow is aging. Solar needs working capital to fund EPC project cycles and will absorb most of the 600 crore if it is to hold leadership in a 27 percent market. Snacks would need serious money in trade schemes and advertising to move from 6 percent share. The 600 crore cannot fund both Solar and a real Snacks push. This constraint, not the labelling, is what the case is actually testing.
Make the binary Question Mark call
Snacks gets a build-or-exit decision, not a trickle. Going from 6 to 15 percent share against a 34 percent incumbent in Indian FMCG means several hundred crore of distribution and brand spend over three years with an uncertain payoff, and Nirvaan has no FMCG distribution muscle. Recommendation: do not half-fund it. Either sell the snacks brand to a larger foods company, or deliberately shrink it into a defensible regional play in Maharashtra where share is already higher.
Deal with the big Dog, which is where the money is
Cement is the largest single unlock. A 9 percent share in one state against a 31 percent national leader means Nirvaan will never win on cost, and consolidating Indian cement players pay real multiples for regional capacity. Selling it could release several thousand crore of capital and, just as valuable, management bandwidth. Before recommending the exit, check linkages: does cement share logistics, land or key relationships with the other units? If not, it goes. Textiles is small and should simply be sold or shut.
Turn it into a funded plan
Allocate the full 600 crore to Solar EPC to defend its 1.1x leadership while the market compounds at 27 percent. Keep Auto Components running lean, protecting share with maintenance capex only, and use its cash to cover group overheads. Exit Cement and Textiles, then use the proceeds either to scale Solar faster or to fund a decisive Snacks push, but only if the board will commit for three full years. Review in twelve months against one milestone per unit: Solar relative share still above 1.0x, Auto share stable, Cement sale signed.
Takeaway: The matrix did not just label five businesses. It showed that the biggest lever was not the 600 crore of new capex but the capital already trapped in a large Dog, and it forced the Question Mark into a fund-it-properly or sell-it decision instead of a comfortable middle path. That is the real output of the tool: where cash comes from, where it goes, and what you stop doing.
More worked examples
Worked example: ITC's portfolio and the 2025 hotels demerger+
ITC Ltd is the cleanest real-world test of the growth-share matrix available to an Indian candidate, because its segments sit in four completely different boxes and the company made a very public portfolio decision in 2024-25. ITC reports five segments: Cigarettes, FMCG-Others (foods, personal care, education products), Hotels, Agri Business, and Paperboards & Packaging. Cigarettes contribute roughly 40-45 percent of gross segment revenue but historically around three-quarters of segment EBIT, while FMCG-Others contributes around a quarter of revenue and only a small slice of profit. In 2024-25 ITC demerged its hotels business into a separately listed ITC Hotels, retaining a minority stake and distributing the rest to shareholders. All figures below are approximate, publicly reported orders of magnitude used for illustration, not audited precision.
Cigarettes share of segment EBIT
~75-80% (approx)
Cigarettes relative market share
~6x vs no. 2 (approx)
FMCG-Others revenue
~Rs 21,000 cr (approx)
FMCG-Others EBITDA margin
~2% a decade ago to ~10-11% now (approx)
Hotels share of group revenue
~4% (approx)
Define the unit of analysis, and refuse to accept the reported segments blindly
The five reported segments are the obvious starting units, but two of them fail the standalone test. Agri Business is substantially an input engine: it sources leaf tobacco for Cigarettes and wheat and spices for Foods, so a chunk of it is transfer-priced internal supply that you cannot sell or shut without damaging two other units. FMCG-Others is the opposite problem: it is far too coarse, because Aashirvaad atta, Sunfeast biscuits, Bingo snacks, Classmate notebooks and Savlon are in wildly different competitive positions and averaging them hides everything. In an interview say this out loud: I will treat Cigarettes, Hotels and Paperboards as units, split FMCG into its top four brand clusters, and treat only the third-party export part of Agri as a real unit.
Measure market growth per unit, not ITC's own growth
Legal cigarette volumes in India have grown at low single digits at best, structurally capped by taxation and by an illicit trade widely estimated at roughly a quarter of total consumption, so this is unambiguously a low-growth market even when ITC's revenue rises on price. Packaged foods runs at roughly high single to low double digit nominal growth, comfortably above a 10 percent cut-off once you include premiumisation. Hotels post-COVID has been one of the fastest-growing consumer markets in India, with double-digit RevPAR growth and a national room-supply build-out, so it goes firmly above the line. Paperboards is low growth and cyclical, squeezed in recent years by cheap imported paper. So the growth axis splits: Foods and Hotels high, Cigarettes and Paperboards low.
Compute relative share, and watch the FMCG split do the work
Cigarettes: ITC holds roughly three-quarters or more of legal Indian cigarette volumes against a number two in the low teens, so relative share is somewhere around 6x. That is not leadership, it is near-monopoly, and it explains the EBIT concentration. Inside FMCG the picture fractures: Aashirvaad is the leading branded atta, so relative share is above 1.0x, a Star; Bingo is a strong number two in salty snacks against a much larger leader, so roughly 0.5-0.6x; Sunfeast is a clear number three in biscuits behind two entrenched giants, so perhaps 0.25-0.3x. Hotels: ITC is among the top four or five Indian chains by rooms but well behind the leader, so relative share sits meaningfully below 1.0x despite the brand's prestige. One segment, three different quadrants.
Size the bubbles by capital employed and read the cash flow
Size by capital employed rather than revenue and the portfolio's real shape appears. Cigarettes is a modest-capital, enormous-cash unit throwing off the profit that funds everything else. Hotels was the reverse: a small share of group revenue but a large, slow-turning pile of owned real estate earning a return on capital far below the group average, which is precisely why analysts spent a decade arguing it depressed ITC's multiple. FMCG absorbed roughly a decade of cigarette cash before it turned meaningfully profitable, with margins climbing from around 2 percent to roughly 10-11 percent. The cash test is stark: one cow funds one Star, several Question Marks, and one very capital-hungry unit.
Force the binary Question Mark decision, which is exactly what ITC did
Hotels is the textbook Question Mark: a genuinely attractive high-growth market where ITC lacks leadership and where winning would mean committing thousands of crores of owned-asset capex against a leader that is scaling faster on an asset-light management-contract model. The matrix says you either fund it to leadership or you stop carrying it, and never fund it comfortably in the middle. ITC's 2024-25 answer was structurally elegant: demerge Hotels into its own listed entity, retain a minority stake, and hand shareholders the rest. That is the divest-or-fund decision resolved without a fire sale, because Hotels now raises capital against its own balance sheet and is valued on hotel multiples rather than dragging the group's return on capital.
Overlay the direction of travel, because the cow is the fragile part
Draw the three-year arrows and the comfortable reading inverts. The Cash Cow is high share but its low growth is policy-set: a single large GST or cess revision can compress volumes and profit, and a growing set of institutional investors exclude tobacco outright, which caps the multiple. Meanwhile FMCG is moving up and right, with atta and snacks scaling and margins still expanding, so it is a Star in the making, and Paperboards risks drifting from a modest cow toward a Dog if import pressure persists. The portfolio question is therefore not what to sell today but whether FMCG's profit pool can grow fast enough to matter before the cigarette engine faces its next regulatory shock.
Takeaway: The matrix explains ITC's actual strategy better than any narrative: milk a near-monopoly cash cow, spend a decade of that cash converting a Question Mark FMCG business into a Star, and resolve the one Question Mark you cannot fund to leadership by giving it its own balance sheet rather than half-funding it forever. The lesson for a candidate is that the interesting box is rarely the cow. It is the capital-heavy Question Mark, and the honest answers there are fund it properly, sell it, or demerge it.
Worked example (case-style): Anand Motors allocating Rs 1,800 crore across six two-wheeler platforms+
Anand Motors is a listed Indian two-wheeler maker with roughly Rs 34,000 crore of revenue. The new CEO has about Rs 1,800 crore of annual free cash available for growth investment plus Rs 4,000 crore on the balance sheet, and six product platforms all asking for money. The board wants to know which platforms get funded, which get cut, and whether the portfolio can pay for itself. All figures are illustrative case numbers. The platforms are: 100-110cc commuter motorcycles (Rs 21,000 cr revenue, market growing ~2%, share 44% vs no. 2 at 24%), spare parts and accessories (Rs 2,600 cr, market growing ~6%, relative share ~2.0x), 125cc scooters (Rs 4,200 cr, market growing ~14%, share 9% vs leader at 46%), premium 160-250cc motorcycles (Rs 3,100 cr, market growing ~13%, share 6% vs leader at 28%), electric two-wheelers (Rs 1,800 cr, market growing ~45%, share 7% vs leader at 24%, losing ~Rs 400 cr a year), and mopeds (Rs 1,300 cr, market shrinking ~4%, share 11% vs leader at 62%).
Commuter relative share
1.8x (44/24)
EV relative share
0.29x (7/24)
Cash available for growth
~Rs 1,800 cr (illustrative)
Total Question Mark ask
~Rs 2,400 cr (illustrative)
Funding gap
~Rs 600 cr (illustrative)
Set the unit of analysis and the two cut-offs explicitly
The unit here is a product platform, not a division, because that is what Anand can actually fund, license out or discontinue as a whole. Set the growth cut-off at 10 percent: that separates scooters at 14 percent, premium at 13 percent and EV at 45 percent from commuter at 2 percent, parts at 6 percent and mopeds at minus 4 percent. Set the share cut-off at a relative share of 1.0x. Say this out loud in the interview and justify it: in a capital-intensive assembly business, roughly 10 percent market growth is the point at which a platform stops funding its own capacity additions and starts drawing on group cash, which is the cash logic the whole matrix rests on.
Do the relative share arithmetic and place the six bubbles
Commuter is 44/24 = 1.8x at 2 percent growth, so it is the Cash Cow and by far the largest bubble at Rs 21,000 cr. Parts is roughly 2.0x at 6 percent growth, a second and much more profitable Cash Cow. Scooters is 9/46 = 0.20x, premium is 6/28 = 0.21x and EV is 7/24 = 0.29x, all in fast markets, so three Question Marks. Mopeds is 11/62 = 0.18x in a shrinking market, a clear Dog. Note the shape immediately: one dominant cow, one small hidden cow, three question marks and a dog. There is no Star anywhere in this portfolio, which is the single most important structural observation on the page.
Read the cash flow and prove the portfolio cannot fund itself
Run the money. Commuter at roughly a 14 percent EBIT margin generates about Rs 2,900 cr and parts at roughly 25 percent generates about Rs 650 cr, so the cows produce around Rs 3,550 cr of EBIT. Strip out maintenance capex of roughly Rs 900 cr, corporate overhead of roughly Rs 600 cr and tax, and you are left with the stated Rs 1,800 cr of usable cash. Now the asks: EV needs about Rs 1,200 cr a year to cover its Rs 400 cr loss plus battery, platform and network investment; scooters needs about Rs 700 cr for a new platform and dealer push; premium needs about Rs 500 cr for engine development and brand spend. That is Rs 2,400 cr against Rs 1,800 cr, a gap of roughly Rs 600 cr before anything goes wrong. The case is not about labels, it is about this gap.
Make the Question Mark calls binary instead of spreading the money
Funding all three at 75 percent of what they need is the classic way to lose in all three, so force a ranking. EV must be funded fully: a 45 percent growth market compounds share positions fast, and at 0.29x today Anand has perhaps two to three years before the leaders' scale and charging footprint make the gap unbridgeable. Scooters gets funded second because it is the largest of the three at Rs 4,200 cr, shares engine and chassis engineering with the commuter cow, and moving from 9 to 15 percent share is a plausible three-year target against a fragmented field behind the leader. Premium gets the exit-shaped answer: at 0.21x with an entrenched aspirational leader, Anand should stop in-house development and pursue a licensing or joint-venture route, which converts a Rs 500 cr annual cash drain into a capital-light presence.
Free the trapped capital and check the Dog for linkages before killing it
Mopeds is a Dog on both axes, but do not divest reflexively. Check the linkages first: does it absorb factory overhead, keep rural dealers viable, or feed the parts business through the vehicle parc? If mopeds shares a plant line and a rural dealer network with the commuter cow, shutting it raises the cow's unit cost and thins distribution. The lazy but correct answer here is to stop all mopeds investment, run it for cash on the existing tooling, and convert the line to EV assembly as volumes decline, which closes most of the Rs 600 cr funding gap without a disruptive shutdown or a write-off.
Overlay the three-year arrows, and notice the cow is the thing at risk
Draw where each bubble is heading. The commuter Cash Cow looks safe at 1.8x, but electric two-wheelers are eating exactly the 100-125cc use case, and if EVs take a quarter to a third of that segment's volume within five years, today's cow is tomorrow's large Dog. The parts cow is quietly exposed too, because EVs have far fewer serviceable components, so a business earning 25 percent margins on the existing parc structurally shrinks as the fleet electrifies. That reframes the whole allocation: EV investment is not an optional growth bet competing with scooters, it is the succession plan for the cow that pays for everything else.
Takeaway: The matrix produced a funded, sequenced plan rather than four labels: put the full Rs 1,200 cr into EV, put Rs 700 cr into scooters, take premium off the balance sheet via a licensing partner, harvest mopeds and convert its line to EV assembly, and hold commuter and parts on maintenance capex only. The deeper insight is the one only the direction-of-travel overlay gives you: this portfolio has no Star, and the cash cow funding everything is itself the unit being disrupted, so the EV Question Mark is the least optional item on the list.
Common pitfalls
- •Using absolute market share instead of relative market share. Ten percent share is strong against a leader with 12 percent and hopeless against a leader with 55 percent. Always divide by the largest competitor's share.
- •Confusing the unit's own revenue growth with market growth. A division growing 8 percent inside a market growing 20 percent is losing share and belongs on the low-share side, not in the comfortable box.
- •Treating Dogs as automatically disposable. Some Dogs supply a Star, keep a distribution channel alive, absorb factory overhead, or block a competitor. Check the linkages before you recommend an exit.
- •Over-milking Cash Cows or funding every Question Mark a little. Starving a mature leader turns it into a Dog within a few years, and spreading capital thinly across four opportunities usually loses money in all four.
- •Presenting the four labels as the answer. Sorting businesses into boxes is the analysis, not the recommendation. If you have not said how much money moves where and what gets sold, you have not finished.
- •Forgetting that the matrix is a static snapshot, and that growth plus share is only a crude proxy for attractiveness and advantage. Always overlay where each unit is heading, not just where it sits today.
Interview tips
- •Draw the 2x2 on the page and physically place the businesses as bubbles sized by revenue or capital employed. Interviewers remember candidates who make the data visible, and bubble size instantly surfaces the large-Dog insight.
- •State your cut-offs out loud and justify them. Saying I will use 10 percent market growth and 1.0x relative share, and here is why for this industry, signals you understand the framework rather than reciting it.
- •Do the relative share arithmetic explicitly, even roughly. Saying 6 over 34 is about 0.18x, so we are a distant number four is far stronger than saying we have low share.
- •Never lead with the four animal names. Open with the question the matrix answers: I want to work out which businesses generate cash, which consume it, and whether the portfolio funds itself. Then let the quadrants fall out of that.
- •Add the axis the framework misses. Mention profitability, capital employed or strategic fit as a third lens, and note that the McKinsey GE nine-box matrix exists for exactly that reason. This is the easiest way to show maturity beyond a textbook answer.
- •Close with a sequenced recommendation, a number and a trigger. Fund Solar with the full 600 crore, exit Cement, revisit Snacks in twelve months if share crosses a set threshold. Specificity is what gets scored.
Test yourself
Best video explainers

BCG Matrix (Growth-Share Matrix) EXPLAINED | B2U | Business To You
Business To You
The cleanest visual walkthrough of both axes, with a full Samsung portfolio worked through on screen. Best single starting point if you have never seen the matrix.

BCG Matrix (Growth Share Matrix) | Explained by a BCG Consultant
Prepmatter
Taught by a former BCG consultant, so it covers how the matrix is actually used on engagements and in interviews rather than how textbooks present it.

BCG Matrix explained by Ex-BCGer 😎 (ISB MBA)
Shatakshi Sharma (all things career & lifestyle)
An ex-BCG, ISB-MBA take pitched squarely at Indian candidates: how the 2x2 is actually deployed in client work, interviews and even personal decisions, with Indian company examples.

BCG Matrix (With Real World Examples) | From A Business Professor
Business School 101
Short, structured and example-heavy. Good for seeing several real company portfolios classified quickly so the quadrant judgements start to feel intuitive.
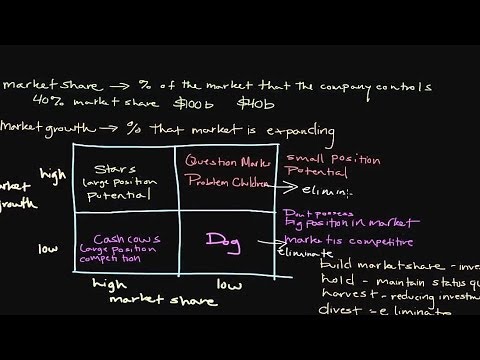
How the Boston Consulting Group (BCG) Growth-Share Matrix Works
Alanis Business Academy
The most rigorous free lecture on the mechanics: it insists on relative market share rather than raw share and walks the cash-flow logic quadrant by quadrant, which is where most candidates get caught.
Go deeper
What Is the Growth Share Matrix?
Boston Consulting Group
The originating firm's own page, including Bruce Henderson's origin story and BCG's candid view on how the matrix must be adapted for faster-moving modern markets.
Growth-share matrix
Wikipedia
Best free source for the precise mechanics: the 10 percent growth threshold, the relative-share ratio, the intended success sequence, and the academic criticisms of portfolio planning.
Boston Consulting Group (BCG) Growth-Share Matrix
Strategic Management Insight
A step-by-step build guide with worked calculations for both axes, plus a clear comparison against the McKinsey GE nine-box alternative.
Boston Consulting Group (BCG) Matrix
Corporate Finance Institute
Concise finance-oriented summary that frames each quadrant in cash-generation and investment terms, which is exactly how you should talk about it in a case.
How to use the BCG Matrix
Smart Insights
Practical application angle for product and brand portfolios, useful when the unit of analysis in the case is SKUs or brands rather than whole divisions.
Now use it on a real case
Reading a framework isn't the same as applying it under pressure. Practise with an AI interviewer that pushes back.
Practise a case free