Ansoff Matrix
Four ways to grow — sell more of what you have, or bet on new products and new markets, ranked by risk.
On this page
The gist
- →A 2x2 of product (existing/new) x market (existing/new): Penetration, Market Development, Product Development, Diversification.
- →The boxes are ranked by risk — Penetration is the cheapest rupee, Diversification the most expensive. Fund the growth gap in that order.
- →It only generates options; pair it with sizing, a competitive read and a right-to-win (VRIO) check before recommending anything.
- →Strong answers sequence, not pick: safe boxes fund the risky bets, with diversification ring-fenced as a stage-gated pilot.
The framework at a glance
When to use it
Reach for Ansoff whenever the prompt is about growth rather than a problem to fix. Typical triggers: "Our client wants to double revenue in three years — how?", "The board has approved 500 crore for growth, where should it go?", "Our core market is saturating, what next?", "Should we launch a new product line or push harder in existing states?", "A PE fund is buying this company and needs a five-year growth plan." It is also the right structure when an interviewer asks a broad brainstorm question like "what are all the ways this company could grow?" — Ansoff guarantees you cover new products and new markets instead of only listing sales tactics. Do not use it for a profitability decline (use a profit tree), a pure market-entry question where the market is already chosen (use a market-entry framework), an operational or cost problem, or a portfolio question about which existing business units to fund (use the BCG Matrix or Three Horizons).
What it is
The Ansoff Matrix is a growth-options tool. It was created by H. Igor Ansoff, an applied mathematician turned business strategist, in a 1957 Harvard Business Review article called Strategies for Diversification, and it is still the fastest way to answer the question every CEO eventually asks: where is our next rupee of revenue going to come from? The tool works by taking two variables — the product you sell and the market you sell it to — and asking whether each is existing or new. Cross those two and you get a 2x2 with four boxes, sometimes called the Product/Market Expansion Grid.
Keep reading ↓Show less ↑
The four boxes are Market Penetration (existing product, existing market — sell more of the same thing to the same people), Market Development (existing product, new market — take what you already make to a new geography, segment, or channel), Product Development (new product, existing market — build something new for customers you already own), and Diversification (new product, new market — a genuinely new business). The single most important idea in the matrix is not the four labels; it is that they are ordered by risk. Penetration is cheapest and safest because you already have the product, the factory, the brand, and the customer relationship. Every step away from that base adds a new unknown. Diversification is riskiest because you are learning the product and the customer at the same time, with no existing asset to fall back on — Ansoff himself split it into related diversification (some link to what you do today) and unrelated or conglomerate diversification (none).
What the matrix is not: it is not an answer, and it is not an analysis. It generates options and sorts them by risk. It says nothing about whether the market is attractive, whether you can beat the incumbent, or whether the new business will make money. That is why in a real case you use Ansoff to structure the menu of growth moves, then use other tools to pick from the menu — market sizing to see if a box is big enough, Porter's Five Forces or a competitive read to see if it is winnable, VRIO or a capability check to see if you have the right to win, and a profitability tree to see what it does to margins. Ansoff opens the conversation; it does not close it.
How to apply it, step by step
- 1
Anchor the growth gap and the clock
Before drawing any 2x2, get the number. Ask what revenue or profit the client is at today, what they want to reach, and by when. Grow revenue from 800 crore to 1,600 crore in four years turns a vague question into an 800 crore gap. Also ask what the base business will do on its own — if existing momentum delivers 300 crore, the strategy only has to find 500 crore. Every option you generate later gets measured against that gap.
- 2
Define existing and new out loud
This is where most students get sloppy. State explicitly what counts as the existing product (the SKU, the category, the service) and the existing market (which geography, which customer segment, which channel). Is Bengaluru a new market for a Mumbai brand, or the same urban Indian market through a new city? Is selling the same shampoo on Blinkit a new market or a new channel? There is no universally right answer, but stating your definition makes the whole matrix crisp and interviewers reward it.
- 3
Fill every box with two or three concrete moves
Do not stop at the four labels — those are headings, not ideas. Under Penetration write things like increase purchase frequency, win share from competitor X, convert non-users, deepen distribution in existing towns, change price. Under Market Development write new states, rural versus urban, exports to the Gulf diaspora, B2B versus B2C, modern trade versus kirana. Under Product Development write line extensions, a value pack, a premium tier, a services layer. Under Diversification name a specific business, never just the word diversify.
- 4
Size each box top-down
Put a rough number on the biggest four to six moves so you can rank them. Penetration maths is usually users times frequency times price, or current share versus achievable share. Market development is new-market size times realistic share times time to reach it. Product development is existing customer base times attach rate times price, minus the volume it cannibalises. Rough is fine — state your assumptions and the interviewer will correct the ones that matter.
- 5
Risk-adjust before you compare
A 200 crore penetration play and a 200 crore diversification play are not equal. Apply a haircut for the odds of success and say why: new product or new customer means new capabilities, new competitors, longer payback and higher capex. This ordering is Ansoff's whole point. A simple three-column scorecard — revenue potential, investment needed, probability of success — beats any amount of hand-waving.
- 6
Test the right to win on anything new
For every move outside the penetration box, ask what asset makes this client the one to win it: brand permission with the customer, distribution reach, manufacturing cost advantage, data, a licence. If a packaged-food brand wants to sell financial services, the honest answer is that neither its brand nor its distribution transfers. This is where you fold in a quick VRIO or capability check, and it is the fastest way to kill a bad diversification idea in an interview.
- 7
Sequence rather than pick one
Strong recommendations rarely say do only diversification. They say: fund the near-term gap with penetration and market development, which pay back in 12 to 18 months, and use that cash to seed one product-development bet now and one diversification option as a small pilot or partnership. Explicitly linking cash from the safe boxes to funding the risky box shows commercial judgement and is exactly how consulting recommendations are written.
- 8
Close with risks, metrics and kill criteria
Name the top two or three risks — cannibalisation of the core, channel conflict, regulatory approval, competitor response, execution bandwidth. Then say how you would know it is working: share of wallet and repeat rate for penetration, distribution points and same-store sales for market development, attach rate and gross margin for product development, and for diversification a stage gate with a named metric and a date at which you stop.
Worked example
Illustrative case prompt: Amul's dairy business in mature metro India. Liquid milk, butter and cheese in the big cities are growing at only four to five percent a year as Mother Dairy, Nandini, local dairies and D2C players fight for the same households. The board wants 10,000 crore of incremental annual revenue within four years. Where should it come from? (All numbers below are round and illustrative — the method is the point.)
Step 1 — Frame the gap
Target is 10,000 crore of new annual revenue in four years. Existing momentum at five percent on the metro dairy base delivers perhaps 3,500 to 4,000 crore of that on its own, so the strategy actually has to find roughly 6,000 crore. Define the existing product as liquid milk, butter, cheese and curd, and the existing market as urban Indian households buying through kirana, modern trade and quick commerce.
Step 2 — Market Penetration (same product, same market)
Levers: shift households from the 500 ml pack to the one-litre pack, win share from unbranded loose milk which is still a very large share of Indian consumption, deepen quick-commerce availability so an Amul pack is never out of stock at 8 pm, and launch a daily-delivery subscription. Rough size: converting even two percent of loose-milk volume in the top twenty cities is worth on the order of 2,000 to 2,500 crore. Low capex, uses the existing cold chain, payback under eighteen months. This is the workhorse.
Step 3 — Market Development (same product, new market)
Take the same butter, cheese and UHT milk to markets Amul under-serves: eastern and north-eastern states where branded dairy consumption per head is far below the west, institutional and HoReCa buyers such as hotels, cloud kitchens and bakeries rather than households, and exports of shelf-stable ghee, paneer and milk powder to the Gulf and North American diaspora. Rough size: 1,500 to 2,000 crore. The main risk is cold chain and distributor build-out in the east — the product travels fine, the logistics do not, so UHT and powder go first and fresh follows.
Step 4 — Product Development (new product, same market)
Same urban households, new products: high-protein whey and lassi drinks for the gym and health segment, lactose-free milk, Greek yoghurt, cold coffee, and value-added ice cream. These ride existing brand trust, the same retailers and the same trucks — the sales force is already in the store. Rough size: about 1,500 crore. Watch cannibalisation: a protein lassi that simply replaces a plain lassi purchase adds margin but far less volume than the gross number implies.
Step 5 — Diversification (new product, new market)
Genuinely new on both axes: organic staples such as atta and pulses sold to a health-conscious buyer Amul does not serve today, a franchised Amul cafe and QSR chain, or plant-based beverages for customers deliberately avoiding dairy. Right-to-win test: the brand carries permission in food and cooperative sourcing is a real asset, so organic staples is related diversification and defensible. A national cafe chain means real estate, hospitality operations and staffing — capabilities the cooperative does not have. Rough size 500 to 1,000 crore, three to five year payback, highest failure odds.
Step 6 — Recommend and sequence
Fund roughly sixty percent of the gap from penetration (loose-milk conversion plus quick-commerce depth), about twenty-five percent from market development in the east and HoReCa, and about fifteen percent from product development in high-protein and value-added dairy. Take diversification as a ring-fenced pilot only: organic staples in three cities with a stage gate at twelve months, and franchise the cafe concept rather than owning it. Track loose-milk conversion share, distribution points added in the east, attach rate and gross margin on the protein range, and a hard go or no-go date on the pilot.
Takeaway: The four boxes are not four equal choices. Almost all of the near-term, low-risk rupees sit in penetration and market development, and the honest role of diversification is a small, ring-fenced, stage-gated bet funded by the cash the safe boxes throw off. In an interview it is that sequencing — plus the right-to-win test that killed the cafe idea — that separates a real recommendation from a list of four labels.
More worked examples
Worked example: how Netflix answered its 2022 growth stall+
In early 2022 Netflix publicly reported its first quarterly loss of paid subscribers in over a decade, and the stock fell hard. The business was roughly 220 million paid memberships worldwide, with the US and Canada — its most profitable region — already at around 75 million and visibly saturating. The board question was the classic Ansoff question: the core engine of growth (add more paying households to a flat-rate streaming plan) had stopped, so where does the next dollar come from? Running the matrix backwards over what Netflix actually did between 2022 and 2025 is one of the cleanest real-world illustrations of all four boxes being played at once, in risk order. (Figures below are public, rounded and illustrative — treat them as approximate.)
Paid memberships at the stall (2022, approx)
~220 million
Households sharing a password (company estimate, approx)
~100 million
US ad-tier launch price (Nov 2022)
$6.99 / month
India mobile-only plan after the 2021 price cut (approx)
~Rs 149 / month
Full-year revenue, 2024 (approx)
~$39 billion
Step 1 — Anchor the gap and define existing product and existing market out loud
The existing product is a flat-rate, ad-free, on-demand streaming subscription. The existing market is the broadband household that pays for it. Stating it that precisely matters, because it immediately shows where the ceiling is: in the US and Canada, Netflix was already inside roughly 75 million of maybe 120 to 130 million broadband homes, so simple household penetration could not deliver much more. Note there are two different customers hiding here — the viewer and, later, the advertiser — and the box you assign a move to depends entirely on which of them you call the market. Most students get the Netflix case wrong precisely here.
Step 2 — Market Penetration (same product, same market): monetise the people already watching
The single largest penetration lever was already inside the house. Netflix said roughly 100 million households were watching on someone else's account, about 30 million of them in the US and Canada. These are existing users in the existing market consuming the existing product for free. Paid sharing, rolled out broadly through 2023, converted a share of them into paying or extra-member accounts. The arithmetic is simple enough to do out loud: even a 10 percent conversion of 100 million freeloading households at roughly $100 of annual revenue each is on the order of $1 billion a year, with essentially zero incremental content cost because the catalogue and the CDN are already built. That is the cheapest revenue in the entire matrix, which is exactly why it went first.
Step 3 — Market Development (same product, new market): the price ladder and Asia
Two moves, both taking the same streaming product to households it could not previously reach. First, price: the ad-supported tier at $6.99 in the US and mobile-only plans in India at roughly Rs 149 to 199 open up income segments for whom $15.49 was simply out of range. Second, geography: after opening 130 countries at once in 2016, the growth after 2022 came disproportionately from Asia-Pacific and EMEA rather than the mature West. The trade-off is honest and worth saying in an interview: APAC average revenue per member runs at roughly a third of the US and Canada number, so a member added in Delhi is not a member added in Dallas. Market development here buys volume and long-run optionality, not near-term ARPU, and the enabler is local-language original content, which is a real incremental cost.
Step 4 — Product Development (new product, existing market): games and live events
Games (launched 2021, bundled free with the subscription) and live programming — Jake Paul versus Mike Tyson in 2024, NFL Christmas games, and WWE Raw from January 2025 under a multi-year rights deal — are new products sold to the households Netflix already has. Note what makes this box unusual in a subscription business: neither games nor live events carry their own price tag, so the return does not show up as a new revenue line at all. It shows up as reduced churn and higher engagement hours, which protects the existing revenue base and gives the ad business something to sell. If a candidate cannot explain how a product-development move pays back, that move is usually not funded. Live sports also inverts the classic streaming cost structure: on-demand content is a library asset amortised over years, whereas rights are a recurring fixed cost that must be re-won at renewal.
Step 5 — Diversification (new product, new market): advertisers and physical venues
Two genuinely new-on-both-axes bets. First, and this is the subtle one, the advertising business. To the viewer, the ad tier is a cheaper version of the same product, so it sits in market development. But to Netflix the corporation, selling ad inventory means a new product (impressions) sold to a completely new customer (media buyers and brands), requiring an ad sales force, measurement partnerships and an ad server it did not have — that is diversification, and it is why Netflix leaned on Microsoft and then built in-house. Second, Netflix House, the large experiential retail and dining venues opened from 2025 in Pennsylvania and Texas, plus consumer products off Stranger Things and Squid Game. Right-to-win test: for advertising, the asset that transfers is an enormous first-party audience with real targeting data, so the permission is genuine. For physical venues, almost nothing transfers — real estate, food service and hourly staffing are not streaming capabilities — which is why it is a handful of sites and licensing deals rather than a national rollout.
Step 6 — Risk-adjust, sequence, and read the answer
Ranked by cost per incremental dollar: paid sharing was near-free and landed within four quarters; the ad tier and international price laddering required real product and pricing work but reused the whole content base; games and live rights required new capability and hundreds of millions in commitments; venues required capital in a business with no operating history. The sequencing follows exactly that order, and the cash from the penetration and pricing moves is what funded the sports rights and the ad-tech build. Also worth noting what Ansoff did not tell you: it never said whether Disney+ or Prime Video would respond, whether the WWE rights were priced correctly, or what the ad tier does to blended margins. Those needed a competitive read and a unit-economics model on top.
Takeaway: Two lessons. First, a company under a growth stall does not choose one quadrant — it runs all four, but funds them in risk order, using the near-free penetration revenue (paid sharing) to pay for the expensive bets (live rights, ad-tech, venues). Second, and the more examinable point: which box a move belongs to depends entirely on how you define the market. Netflix's ad tier is market development if the customer is the viewer and diversification if the customer is the advertiser — and it is actually both, which is why it was simultaneously the easiest and the hardest thing the company did.
Worked example: Indian case interview — doubling a South India diagnostics chain+
Your client is a diagnostics chain with about Rs 2,400 crore of annual revenue, roughly 70 percent of it from Tamil Nadu, Karnataka and the Telugu states. The network is 4 reference labs, about 90 satellite labs and roughly 2,200 collection centres, most of them franchised. It serves about 25 million patient visits a year at an average realisation near Rs 960 per visit, with 2.1 tests per visit. Its PE investor wants Rs 5,000 crore of revenue in five years before an exit. Indian diagnostics is roughly a Rs 85,000 crore market of which organised chains hold under a fifth — the rest is standalone neighbourhood labs and hospital in-house labs. Where does the growth come from? (All figures are illustrative case numbers.)
Headline revenue gap (Rs 5,000 cr less Rs 2,400 cr)
Rs 2,600 cr
Gap after base momentum at ~8% CAGR (approx)
~Rs 1,475 cr
Average realisation per patient visit (approx)
Rs 960
Tests per visit, today vs target
2.1 to 2.5
Risk-adjusted organic total from all four boxes
~Rs 1,035 cr
Step 1 — Size the gap and net out momentum before generating a single option
The headline gap is Rs 2,600 crore. But the base business does not stand still: at roughly 8 percent CAGR (in line with organised diagnostics growth), Rs 2,400 crore compounds to about Rs 3,526 crore in five years on its own. So the strategy has to find roughly Rs 1,475 crore of genuinely incremental revenue, not Rs 2,600 crore. Getting this right in the first two minutes changes the whole answer — a candidate hunting for Rs 2,600 crore will over-reach into diversification, and a candidate hunting for Rs 1,475 crore will find most of it in the safe boxes. Also fix the axes now: existing product is the routine pathology test menu; existing market is the walk-in retail patient in the four southern states, referred by a local physician.
Step 2 — Market Penetration (same tests, same southern retail patient)
Three concrete levers. (a) Tests per visit from 2.1 to 2.5 through phlebotomist prompts, doctor-facing panels and reflex testing protocols — that is roughly 10 to 12 percent more realisation on the same footfall, worth about Rs 300 crore on the grown base. (b) Densify inside existing catchments: add about 800 collection centres in towns where the brand already has a reference lab within logistics range, taking share from the standalone lab next door rather than from another chain. At about Rs 30 lakh of mature annual revenue per centre that is roughly Rs 240 crore, and because the centres are franchised, the franchisee funds most of the Rs 8 to 12 lakh setup. (c) Push home collection from 12 percent to 25 percent of visits — higher ticket, stickier, and it is the only channel where the client can beat a standalone lab on convenience rather than price. Call that Rs 150 crore. Penetration total: roughly Rs 700 crore, low capex, payback inside 18 months.
Step 3 — Market Development (same test menu, new buyers)
Two distinct new markets, and they are different businesses. Geographic: replicate the hub-and-spoke into Maharashtra and Gujarat — three new reference labs at roughly Rs 25 to 35 crore capex each plus about 600 franchised centres. Be honest about the ramp: a new centre does maybe Rs 12 lakh in year one against Rs 30 lakh at maturity, and brand recall in Pune is zero, so five-year contribution is only about Rs 200 crore. Institutional: hospital lab-management contracts (running outsourced pathology for 150 to 250-bed hospitals) and corporate wellness for IT campuses in Bengaluru, Hyderabad and Chennai. Same tests, brand new buyer — a procurement head, not a patient — which means a B2B sales team the client does not have and tendered pricing 8 to 10 margin points below retail. Worth about Rs 250 crore of top line but materially less profit per rupee. Market development total: roughly Rs 450 crore.
Step 4 — Product Development (new offerings, same southern patient)
Preventive health packages at a Rs 2,500 to 4,000 ticket against a Rs 960 average is the obvious one — but net it out loud: a large share of package buyers were already buying two or three individual tests, so realistically only about 60 percent of the gross is incremental. Esoteric and molecular testing (NGS oncology panels, allergy and autoimmune panels) carries far better price and gross margin but is low volume and needs a single national reference lab plus specialist pathologists, so it routes to one hub, not ninety. Radiology attached to the top 40 satellite labs is tempting but it is a different business: an MRI is several crore of capex, it needs AERB licensing and radiologists, and it turns an asset-light franchise model into a fixed-cost one. Chronic-care annual subscriptions for diabetic and thyroid patients (four test cycles a year, auto-renewed) is the highest-quality revenue here because it converts an episodic purchase into a recurring one. Product development total: roughly Rs 350 crore, with radiology flagged as a separate capital decision.
Step 5 — Diversification (new product, new market) and the right-to-win test that kills two of three
Three candidates, tested on what asset actually transfers. Pharmacy or e-pharmacy: new product, new economics, heavy working capital, thin regulated margins, and competitors with far deeper pockets — nothing about running a lab gives you an edge in drug distribution. Kill it. Health insurance or a TPA arm: requires IRDAI licensing, actuarial capability and capital; the client has claims-relevant data but no underwriting capability. Kill it. Polyclinics and day-care centres in existing catchments: this is related diversification and the only one that passes, because the client already owns the catchment, the brand and the patient relationship, and a clinic generates its own downstream test referrals — it is vertical integration into demand rather than an unrelated bet. The binding constraint is doctor recruitment and retention, not capital. Pilot 10 clinics at roughly Rs 1.5 to 2 crore each with a stage gate at 18 months on referral capture rate. Contribution: perhaps Rs 100 to 150 crore, mostly option value.
Step 6 — Risk-adjust, and notice the plan does not actually close
Gross across the four boxes is about Rs 1,620 crore against a Rs 1,475 crore requirement, which looks comfortable — until you haircut it. Apply rough probabilities of success: 80 percent on penetration (proven playbook, existing assets), 60 percent on market development (no brand in the west, slow ramp), 50 percent on product development (cannibalisation plus capability gaps), 25 percent on diversification. That gives roughly Rs 560 + Rs 270 + Rs 175 + Rs 30, or about Rs 1,035 crore risk-adjusted — a shortfall of roughly Rs 440 crore against the target. This is the moment the framework earns its keep: the honest read is that the organic plan does not get the investor to Rs 5,000 crore.
Step 7 — Recommend: buy the weakest box instead of building it
The shortfall sits almost entirely in market development, which is also the box with the worst build economics — five years of brand-building in Maharashtra to reach Rs 200 crore. So convert build into buy: acquire an established regional chain in the west doing Rs 300 to 400 crore, which delivers the geography, the reference-lab infrastructure, the doctor referral network and the local brand on day one, and de-risks the slowest ramp in the plan. Fund it from the penetration cash, which throws off margin from month one. Final allocation: roughly 45 percent of the gap from penetration, 20 percent from an acquired western platform plus institutional B2B, 25 percent from product development led by preventive packages and chronic subscriptions, and diversification capped at a 10-clinic pilot. Metrics: tests per visit, centres added inside existing catchments, home-collection share, subscription renewal rate, and for the clinic pilot a hard go or no-go on referral capture at 18 months.
Takeaway: Ansoff generated the menu, but the decision came from risk-adjusting it: once the four boxes were haircut by probability of success, the organic plan fell about Rs 440 crore short of the Rs 5,000 crore target, and the shortfall was concentrated in the single box (geographic market development) with the slowest ramp and the weakest right to win. The recommendation therefore is not a quadrant at all — it is buy rather than build the weakest quadrant, funded by the cash the penetration box generates, with diversification ring-fenced to a stage-gated 10-clinic pilot.
Common pitfalls
- •Reciting the four labels as if that were an answer. Saying they can do penetration, market development, product development or diversification is a definition, not analysis. The value is entirely in the specific moves you list inside each box and the numbers you attach to them.
- •Leaving new market undefined. New city, new state, new country, new customer segment, new channel and new use occasion are all different things with wildly different costs. Pick a definition and say it out loud, or the matrix turns to mush.
- •Ignoring cannibalisation. A premium variant that mostly steals sales from your existing variant adds far less top line than the gross number suggests. Net it out and comment on the margin effect either way.
- •Recommending diversification because it sounds bold. The risk ordering is Ansoff's central point, and the large majority of new-market entries fail. Jumping to diversification before exhausting the cheaper boxes inverts the framework.
- •Forgetting what the matrix does not cover. It is silent on competitors, capabilities, unit economics and execution. Pair it with market sizing, a competitive read, a capability or VRIO check and a profit tree before committing.
- •Treating it as a one-way door. Real firms run several boxes at once and stage the risky ones. An answer that picks exactly one quadrant and ignores sequencing usually reads as naive.
Interview tips
- •Use Ansoff as the spine of the growth brainstorm, not as the whole answer. The full arc is: size the gap, use Ansoff to generate options, size and risk-adjust the best ones, then recommend a sequenced plan. Announcing the framework and stopping there is a weak open.
- •Rename the axes for the client. Saying existing products to new customers, which here means taking the same UHT milk to HoReCa buyers, proves you are thinking rather than reciting. Customisation is marked heavily.
- •Always end with a risk ranking. One line — penetration is the cheapest rupee, diversification the most expensive, so fund the gap in that order — is the clearest signal that you understood the framework instead of memorising the grid.
- •Listen for the constraint that eliminates a box. No new capex, no R&D team, regulation blocks exports, the category is declining: each kills a quadrant. Naming the eliminated box and why is a fast, high-credibility move.
- •Do the arithmetic in at least one box. Even rough maths — households times litres times price, or new-market size times achievable share — turns a qualitative list into a recommendation and gives the interviewer something to push on.
- •Have the handoff ready. If the answer lands on market development, switch into a market-entry structure (size, competition, entry mode, economics). If it lands on diversification, be ready to discuss build versus buy versus partner.
Test yourself
Best video explainers
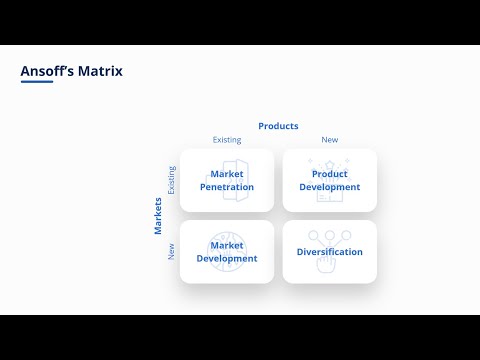
Ansoff Matrix | Overview, Strategies & Examples
Corporate Finance Institute
From CFI, the most credible finance-education channel here — a clean walkthrough of all four quadrants with the risk ordering made explicit.

The Ansoff Matrix Explained with Example
EPM
Builds the grid step by step and works a full example; the best starting point if you have never seen the framework.

Ansoff Matrix Explained | McDonald's Examples
Two Teachers
Populates every quadrant with real McDonald's moves — the fastest way to see one company playing in all four boxes at once.

The Ansoff Matrix / Product-Market Matrix explained, using Pepsi as example
Remy Lemmens
A second worked company example so you can see how the existing-versus-new market definition changes the answer.
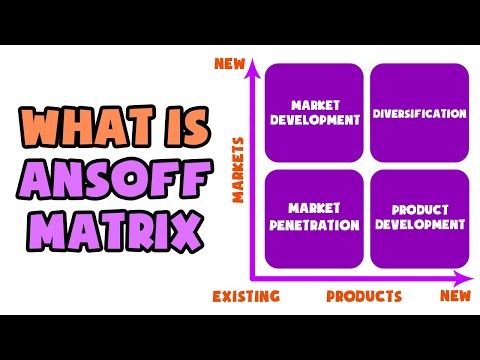
What is Ansoff Matrix | Explained in 2 min
Productivity Guy
Two-minute refresher, ideal for revising the grid the night before an interview.
Go deeper
Ansoff Matrix — Overview, Strategies and Practical Examples
Corporate Finance Institute
Free reference page covering the origin, all four strategies, and how the tool is used to conceptualise the risk of different growth initiatives.
The Ansoff Matrix
MindTools
The classic practitioner explainer, with the direct link back to Ansoff's 1957 HBR article Strategies for Diversification and a risk-first reading of each quadrant.
The Ansoff Matrix: 4 Growth Strategies Explained (With Examples)
Cascade Strategy
Strategy-execution angle with company examples and guidance on turning a chosen quadrant into an actual plan — useful for the so-what half of a case.
Ansoff Matrix: A Practical Guide to Strategic Growth
ClearPoint Strategy
Step-by-step guide to building the matrix for a real company, including how to evaluate and prioritise options rather than just list them.
Ansoff Matrix — Research Starter
EBSCO Research
Neutral, academic-style overview of the framework and its limitations if you want the scholarly framing rather than a consulting blog.
Now use it on a real case
Reading a framework isn't the same as applying it under pressure. Practise with an AI interviewer that pushes back.
Practise a case free