AIDA Marketing Funnel
Attention, Interest, Desire, Action — the buyer's four steps, and the leak is rarely where you assume.
On this page
The gist
- →AIDA is a funnel diagnostic, not a slogan: Attention, Interest, Desire, Action — put real volumes and conversion rates on each stage.
- →Find the leak by benchmarking each step conversion; fix the single biggest gap times the volume flowing into it, not all four stages.
- →Most Indian D2C funnels leak at Action: checkout friction (forced signup, hidden shipping, no UPI) is cheaper to fix than more ads.
- →AIDA ends at the sale — flag retention, repeat purchase and referral (AIDAS/AIDAR) yourself, and pair with STP for who you target.
The framework at a glance
When to use it
Reach for AIDA whenever the case is about persuading people rather than building or costing something. Typical triggers: "design the launch campaign for this product," "our marketing spend is up 40 percent but sales are flat," "our customer acquisition cost has doubled — why?", "we get lots of website traffic but very few orders," "how should a D2C brand introduce itself in a new city or a Tier-2 market," or "our ads win awards but nobody buys." It is also the right tool when a client has strong awareness but weak conversion (or the reverse) and you need to prove which one, because AIDA turns that into stage-wise conversion rates you can actually compute. Do not use it as your main structure for profitability, market-entry sizing, pricing or operations cases — there it is at best one sub-branch under revenue or go-to-market. And pair it with STP: AIDA tells you how to say it, STP tells you who you are saying it to.
What it is
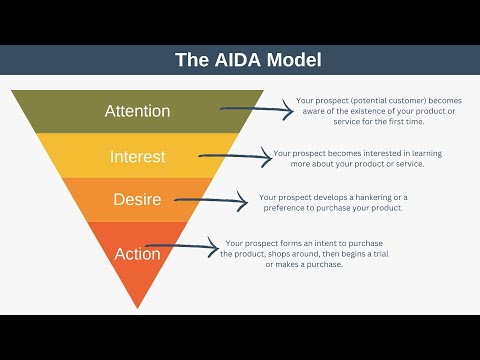
AIDA is the oldest working model in marketing. An American advertising man, Elias St. Elmo Lewis, wrote it down around 1898 while trying to explain why some sales calls worked and others did not. His claim was simple: a stranger does not go from never having heard of you to paying you in one jump. They pass through four mental states in order. First Attention — they notice you exist. Then Interest — they lean in and want to know more. Then Desire — they stop evaluating and start wanting it, for themselves, now. Then Action — they actually do the thing: buy, sign up, book the demo, walk into the showroom.
Keep reading ↓Show less ↑
Drawn out, it is a funnel: a huge number of people at Attention, a much smaller number at Action. That shape is the whole point. Every stage has a drop-off, and the drop-offs multiply. If a lakh people see your ad, 5 percent click, 20 percent of those add to cart, and 40 percent of those pay, you end up with 400 buyers from 100,000 impressions. Change any one of those percentages and the answer moves a lot. So AIDA is not really a creative-writing template — it is a diagnostic. It lets you take a vague complaint like "our marketing is not working" or "our customer acquisition cost has doubled" and force it into a specific question: at which of the four stages are we losing people, and is that stage where the cheapest fix lives?
What AIDA is good at is communication and conversion. What it is bad at is everything after the sale. The model stops the moment money changes hands, which is why it says nothing about satisfaction, repeat purchase, referral or churn — a serious gap in subscription, D2C and app businesses where the second purchase matters more than the first. It also assumes a tidy linear path, and real buyers loop: they see an Instagram reel, forget about it, search on Amazon three weeks later, read reviews, ask a WhatsApp group, then buy offline. Later variants patch this — AIDAS adds Satisfaction, AIDAR adds Retention, and Wijaya's AISDALSLove inserts a Search step and adds Like, Share and Love after the purchase — all of which exist because the original ends too early. Use AIDA for what it is excellent at, campaign and funnel diagnosis, and reach for customer-journey or AARRR when the question is about retention and loyalty.
How to apply it, step by step
- 1
Define the audience and the one action you want
Before touching the funnel, name the segment (from STP if you have it) and write down the single action that counts as success — a paid order, a test ride booked, an app install that completes KYC. Vague goals like "build brand" make every later stage unmeasurable. If there are two audiences with different actions, run two AIDA funnels, not one blended one.
- 2
Build the funnel with real numbers
List the four stages down the page and put the actual volume at each: impressions or unique reach, clicks or store walk-ins, add-to-carts or demo requests, and paid conversions. Then compute the step-to-step conversion rate between each pair. This single table is the most useful thing you will draw in the case — everything after it is interpretation.
- 3
Benchmark each stage and find the leak
Compare each conversion rate to the category norm or to the client's own past performance. One stage will usually be dramatically off. That is the leak. Resist the urge to fix all four — the biggest percentage-point gap against benchmark, multiplied by the volume flowing into it, tells you where the money is.
- 4
Attention: buy the right reach, not more reach
Check who is being reached and how often. High impressions with low unique reach means you are paying to show the same person the same ad nine times — frequency capping alone can free a large share of the budget. Choose channels by where the segment actually is (Instagram and YouTube for urban young India, regional-language creators and Meta for Tier-2, quick-commerce shelf placement for impulse categories) and test hooks, not just channels.
- 5
Interest: lead with the buyer's problem, not your features
The job here is to earn thirty more seconds. That means the message opens on a pain the buyer recognises ("your hair fall is water, not shampoo") before it mentions the product. Practically: a strong landing page above the fold, a short demo video, comparison content, an honest ingredient or spec breakdown. Measure it with click-through rate, bounce rate, scroll depth or time on page.
- 6
Desire: prove the value and beat the alternative
Desire is where you close the gap between "interesting" and "I want this one." Three levers do most of the work: proof (reviews, ratings, user-generated content, a dermatologist or a cricketer if the category is trust-led), a concrete comparison against the specific alternative the buyer is considering including doing nothing, and risk reversal (trial size, 30-day return, EMI). Measure with add-to-cart rate, wishlist adds, demos booked, or showroom test-drive rate.
- 7
Action: remove friction, then add a reason to act now
Most Indian D2C funnels leak hardest here, and the fixes are unglamorous: UPI-first checkout, no forced account creation, a prepaid discount to cut cash-on-delivery, shipping charges shown early instead of at the last screen, and a single unambiguous call to action. Only after friction is removed does urgency help — limited stock, launch pricing, a festive window. Measure with cart-to-order rate, checkout drop-off by screen, and cost per acquisition.
- 8
Size the fix and extend past the sale
Convert your recommended fix into rupees: if cart-to-order goes from 40 to 55 percent on the same traffic, how many extra orders result and what happens to cost per order? Then add the stage AIDA forgets — what makes the buyer come back or refer someone. Naming that gap yourself (AIDAS, or a retention loop) is what separates a good answer from a textbook recital.
Worked example
A Pune-based D2C personal-care brand does about 10 crore rupees of revenue a month online. Marketing spend has climbed to 3 crore a month and the founders say "our CAC has doubled, we need a bigger brand campaign." You are asked whether more brand spend is the right answer.
Lay out the funnel with real numbers
Monthly figures: 6 crore impressions delivered to 67 lakh unique users, so average frequency is about 9. Those produce 12 lakh website sessions. 2.4 lakh sessions add to cart. 96,000 orders are actually paid, at an average order value of roughly 1,040 rupees — which reconciles to the 10 crore of revenue. Spend of 3 crore across 96,000 orders is a cost per order of about 312 rupees.
Compute each step-to-step conversion
Impressions to session: 2 percent. Session to add-to-cart: 20 percent. Add-to-cart to paid order: 40 percent. Now benchmark them. Session-to-cart of 20 percent is strong for the category — the product page is doing its job. Cart-to-order of 40 percent is poor; UPI-led Indian D2C checkouts commonly run 55 to 60 percent. And a frequency of 9 is roughly triple what a considered purchase in this price band needs.
Name the leak
Interest and Desire are healthy: people click, they browse, they add to cart. The funnel breaks at Action. Digging into the checkout, the drop-offs cluster on three screens — a forced account-creation step, a 99-rupee shipping charge revealed only at the final screen, and a slow card OTP flow with no UPI intent option. Separately, Attention is being over-bought: the brand is paying to show the same 67 lakh people the same ad nine times a month.
Size the fix
Lift cart-to-order from 40 to 55 percent on the same traffic and monthly orders go from 96,000 to about 1,32,000 — roughly 3.7 crore of extra revenue on unchanged media spend. Cost per order falls from about 312 rupees to about 227, a 27 percent drop. None of that needed a single extra rupee of advertising. Capping frequency at 3 to 4 then frees a meaningful slice of the prospecting budget to redeploy into retargeting people who abandoned carts.
Answer the actual question, then go one step further
The recommendation is no — a bigger brand campaign is not the first move. Fix checkout in weeks 1 to 4 (guest checkout, UPI intent, free shipping above 599 shown on the product page), cap frequency, and only then revisit top-of-funnel spend once the funnel can convert the traffic it already has. Then flag what AIDA does not cover: repeat rate is 22 percent at 90 days, and a subscribe-and-save option on a consumable would move lifetime value more than any of this — the Satisfaction and Retention stages the classic model leaves out.
Takeaway: AIDA turned a fuzzy complaint ("CAC has doubled, buy more brand") into a specific, quantified answer: the leak is at Action, and the cheapest crore of revenue is sitting inside the checkout page, not inside more impressions.
More worked examples
Worked example: Dollar Shave Club's 2012 launch — earning the Attention you cannot afford to buy+
In March 2012 a US startup with roughly one million dollars of seed funding launched a razor subscription against Gillette, which held around 70 percent of the American men's razor market and spent in the hundreds of millions of dollars a year on media. The challenger had no shelf space, no brand and no ad budget. Run AIDA on the launch and explain, stage by stage, why it worked — and what the model cannot tell you. All figures below are widely reported and used here as approximate, illustrative numbers.
Video production cost
about $4,500 (approx.)
Views, first ~3 months
about 4.75 million (approx.)
Orders, first 48 hours
about 12,000 (approx.)
Implied view-to-order rate
about 0.25% (illustrative)
Entry subscription price
about $1/month + shipping
Define the audience and the single action that counts
The segment is US men roughly 18 to 35 who shave a few times a week, buy replacement cartridges at a drugstore, and are irritated by two very specific things: paying around four dollars per cartridge, and having to find a store associate to unlock the anti-theft cabinet. The action defined as success was not a razor sale but a subscription started, at tiers of roughly one, six and nine dollars a month. That single choice changes every number downstream, because a subscriber pays repeatedly, so the business can tolerate an acquisition cost that would be absurd against a one-off six-dollar sale. If you skip this step and measure 'awareness', nothing later in the funnel is computable.
Attention: the binding constraint is media economics, not product
Gillette's reported US media spend ran into the hundreds of millions of dollars annually, against a seed round of roughly one million. Buying reach at parity was arithmetically impossible, so the only way to win Attention was to make an asset people forwarded for free. The answer was a 93-second video shot in one day in the company's own warehouse for a widely reported four and a half thousand dollars, which drew roughly 4.75 million views in its first three months and crashed the website within an hour of going live. The general lesson for a challenger case: run the four stages and ask which one you are structurally unable to buy — that is where the creative solution has to sit.
Interest: collapse Interest into the Attention asset so there is no gap to leak through
Normally Attention (an ad) and Interest (a landing page or a demo) are separate assets, and the drop-off between them is one of the biggest leaks in any funnel. The launch video deliberately does both jobs in one unit, so almost nobody falls out in between. It opens on the buyer's problem rather than the product — do you like spending twenty dollars a month on brand-name razors, when most of that goes to a celebrity endorser — and then names the exact absurdity of the incumbent: the vibrating handle, the flashlight, the ever-growing blade count. That is textbook Interest technique, re-framing 'premium' as 'you are being overcharged', and a viewer who reaches second 93 has already been walked to the edge of Desire.
Desire: a hard comparison against the real alternative, plus cheap risk reversal
Desire is where 'funny video' becomes 'I want this one', and three levers did the work. First, an explicit price comparison against the specific alternative the buyer already uses — roughly four dollars a cartridge and about twenty dollars a month, versus tiers at roughly one, six and nine dollars. Second, removal of a felt indignity rather than a feature gap: no locked cabinet, no store trip, blades simply arrive. Third, risk reversal — cancel any time, and the entry tier is priced so low that trying it is not really a decision. Notice there is no brand-equity or heritage argument anywhere; Desire was manufactured out of arithmetic and irritation, which is what a challenger should reach for.
Action: one page, one decision, and judge conversion against what the stage cost
Because the model was direct-to-consumer, the distance from Attention to Action was one click rather than a drive to a pharmacy, and the site presented essentially one decision (which of three tiers) and one button. That produced roughly 12,000 orders in the first 48 hours. Now do the funnel arithmetic honestly: about 12,000 orders against roughly 4.75 million eventual views is a view-to-order rate near 0.25 percent, which in isolation looks poor. Divided into a production cost of about four and a half thousand dollars, though, the implied cost per acquired subscriber is well under a dollar. The transferable point for an interview: a conversion rate is meaningless until you divide it into what that stage cost you.
Size it, then name the stage AIDA does not have
The model stops at the first shipment, which for a subscription is exactly where the value begins — the economics depended on months two through twenty-four, not on month one. The company acted on that by widening the box with shave butter and wipes to raise revenue per subscriber and keep the shipment worth receiving. By the 2016 Unilever acquisition it was widely reported at roughly 3.2 million subscribers and about 240 million dollars of annual revenue, sold for a reported one billion dollars, while Gillette's US share is widely reported to have fallen from around 70 percent at the start of the decade to the mid-50s, prompting its own subscription club and double-digit price cuts. If your answer stops at 'the video went viral', you have described Attention and missed the business.
Takeaway: AIDA located the binding constraint at Attention — a challenger cannot outspend an incumbent on media — so the winning move was to build one asset that carried Attention, Interest and Desire together, and to define the action as a subscription so that a sub-dollar acquisition cost could compound. The lesson to carry into a case: run the four stages to find the stage you cannot buy your way through, and design around that one.
Worked example: an EV two-wheeler brand's Tier-2 expansion (Indian case-interview style)+
VoltEdge, an Indian electric two-wheeler brand established in Bengaluru, Pune and Hyderabad, has spent a year expanding into four Tier-2 cities — Nashik, Indore, Coimbatore and Lucknow. Last quarter it spent 6 crore rupees on marketing there and delivered 1,800 scooters at an on-road price of about 1.15 lakh rupees. The CFO wants to cut the price by 10,000 rupees to 'unlock volume'; the CMO wants a bigger regional media campaign. The CEO asks you which of them is right.
Quarterly marketing spend
6 crore rupees (case figure)
CAC today
about 33,300 rupees per scooter
Gross margin per scooter
about 18,000 rupees (approx.)
Test-ride show-up rate
44%
CAC after funnel fix
about 13,600 rupees (illustrative)
Define the audience and the one action that counts
The target is the Tier-2 salaried commuter, roughly 25 to 40, household income 8 to 15 lakh, currently riding a five-year-old Activa or Jupiter, commuting 25 to 45 km a day, and — this is a hard qualifier, not a nice-to-have — living somewhere with reachable parking for a charging point. A tenant with street parking cannot become a customer no matter how good the creative is, so they should be excluded from the denominator. The counted action is a delivered scooter, not a booking, because tokens here are refundable and lapse heavily; measuring bookings would have hidden the entire problem. Gig and fleet riders buy on rupees-per-km rather than aspiration, so they need their own separate funnel and are scoped out.
Build the funnel with real numbers
One quarter across the four cities: 3.2 crore impressions delivered to 48 lakh unique users, so average frequency is about 6.7. Those produce 3.6 lakh website and app sessions, 21,600 test-ride bookings, 9,500 test rides actually taken, 3,400 token payments of 2,999 rupees, and 1,800 deliveries. Put the punchline on the board immediately: 6 crore of marketing across 1,800 deliveries is a customer acquisition cost of about 33,300 rupees on a scooter carrying roughly 18,000 rupees of gross margin. Every incremental unit is currently destroying about 15,000 rupees of value before a single rupee of overhead — this is not a marketing question, it is a survival question.
Compute the step conversions and find the leaks
Impression to session is 1.1 percent, which is fine for a considered one-lakh-rupee purchase. Session to test-ride booking is 6 percent, which is strong — the product page and the offer are working. Booking to ride actually taken is 44 percent, and that is the first leak: these are appointments the customer chose, and more than half evaporate. Ride to token is about 36 percent, respectable for a high-ticket first ride. Token to delivery is 53 percent, and that is the second leak — the customer has already paid money at full price and still walks away. Both leaks sit in the physical middle of the funnel, and neither is where the CFO or the CMO was looking.
Attention: stop paying to repeat yourself, buy presence instead
A frequency of 6.7 in a quarter means the average reached person saw the ad about seven times for a purchase they make once in eight years. Capping frequency at three releases roughly 1.4 crore rupees, about 23 percent of the budget, with essentially no loss of unique reach. The real Attention gap in Tier-2 is not impressions but physical presence: the four cities share only two experience centres, averaging about 14 km from the bookers' pin codes, so the brand is invisible in the places these buyers actually validate decisions. Redeploy the freed budget into mobile demo vans parked at roughly 20 high-density locations per city per month — IT parks, large societies, bank and PSU campuses — plus regional-language creators and dealer-run WhatsApp broadcast lists.
Desire: the drop-offs are objection-driven, not price-driven
Exit interviews across the 56 percent no-shows and the 47 percent lapsed tokens surface the same three objections, and none of them is 'too expensive': a claimed 110 km IDC range against about 78 km real-world with a pillion in city traffic, no service centre within 25 km in two of the four cities, and no idea what the scooter is worth in year four. That is a Desire failure, and the antidote is proof, not discount. The single highest-leverage asset is arithmetic the salesperson currently never shows — an Activa at about 45 km/l with petrol near 105 rupees runs roughly 2.3 rupees per km, versus about 0.33 rupees per km to charge, so a 40 km-a-day rider spends about 2,800 rupees a month on petrol against about 400 on electricity. The 30,000-rupee upfront premium therefore pays back in roughly 12 to 13 months and then saves about 2,400 rupees a month, and that printed calculation, plus a written three-year buyback at 45 percent of ex-showroom and a five-year battery warranty with at-home service, answers all three objections with commitments instead of adjectives.
Fix the show-up leak, which is friction rather than persuasion
The 56 percent no-show rate is the cheapest thing on the list to repair because nothing about it is a belief problem. Slots are offered weekday 10 to 6 only, the centre averages 14 km away, and confirmation is a single SMS with no reminder. Move the ride to the customer instead: a WhatsApp-booked doorstep test ride in a two-hour window, run on the customer's own commute route so the range question answers itself, with a phone reminder the evening before. Taking show-up from 44 to 70 percent is a conservative target once the customer no longer bears the travel cost and the appointment is confirmed by a human.
Size the fix and compare it against the price cut on the table
Hold impressions flat and hold ride-to-token at 36 percent. Show-up rising from 44 to 70 percent takes rides from 9,500 to about 15,120 and tokens to about 5,440; token-to-delivery rising from 53 to 70 percent gives about 3,810 deliveries against 1,800 today. On a slightly reduced 5.2 crore spend that is a CAC near 13,600 rupees, comfortably below the 18,000-rupee gross margin, so the marginal unit makes money for the first time. Now price the CFO's alternative: a 10,000-rupee cut takes gross margin to about 8,000, so volume must go from 1,800 to about 4,050 units, a 2.25x increase, merely to hold gross profit flat — and it attacks a stage the data says is not leaking, since these customers abandoned after paying a token at full price. Finally, name what AIDA omits: EV two-wheeler purchase in India is heavily referral-influenced, so an owner referral incentive and a published real-world range dashboard would compound every number above, which is the Satisfaction and Retention stage the classic model stops short of.
Takeaway: The funnel proved that neither executive was right: awareness was already over-bought at a frequency of 6.7, and price was not the barrier because customers were walking away after paying a token at full price. The money was sitting in two physical-world leaks — 56 percent of self-chosen test-ride appointments lost to 14 km of travel friction, and 47 percent of paid tokens lost to three unanswered objections. Fixing show-up and objection-handling roughly doubles deliveries on flat media spend and moves CAC from about 33,300 to about 13,600 rupees, crossing from below to above the gross-margin line, while the proposed price cut would have needed 2.25 times the volume just to stand still.
Common pitfalls
- •Treating AIDA as a checklist to recite rather than a funnel to quantify. Naming the four stages earns nothing. Putting volumes and stage-to-stage conversion rates against them is the entire value of the tool.
- •Diagnosing the leak by gut feel. Interviewers see candidates declare "the problem is awareness" without checking a single number — when awareness is usually the one stage the client has already over-invested in.
- •Confusing Interest with Desire. Interest is curiosity about the category or the problem; Desire is wanting this specific product over the named alternative. Collapse them and you lose the ability to say whether the client has a positioning problem or a proof problem.
- •Forgetting everything after the purchase. AIDA ends at the transaction, so it silently ignores satisfaction, repeat rate, churn and referral. In subscription, app or consumables cases that is where most of the economics live — flag the gap yourself before the interviewer does.
- •Assuming a clean linear path. Real Indian buyers loop across an Instagram reel, a WhatsApp group, Amazon reviews and an offline store. Say out loud that the funnel is a measurement device, not a claim that every buyer walks the four steps in order.
- •Using AIDA as the top-level structure for a case that is not about persuasion. In a profitability, pricing or supply-chain case it belongs as a branch under revenue or go-to-market, not as your main framework — leading with it signals you pattern-matched on the industry instead of the question.
Interview tips
- •Draw the funnel with numbers on the page within the first two minutes of using it. Four boxes, volume in each, conversion percentage on each arrow. Interviewers reward the visible arithmetic far more than the vocabulary.
- •Say the multiplication out loud once: "1 lakh impressions, 5 percent click, 20 percent add to cart, 40 percent pay — that is 400 orders." It shows you understand why a small lift at one stage compounds, and it sets up your recommendation.
- •Prioritise explicitly. State which single stage you would fix first and why — biggest gap versus benchmark, times the volume flowing into it, weighed against the cost and time to fix. Fixing all four is not a recommendation.
- •Attach a rupee number to your fix before you finish. "Moving cart-to-order from 40 to 55 percent adds 36,000 orders and 3.7 crore a month on the same spend" is a recommendation; "improve the checkout experience" is an observation.
- •Pair AIDA with a partner framework unprompted — STP for who you are targeting, the 4Ps for what you change, customer-journey or AARRR when the question drifts to retention. Naming the handoff shows you know AIDA's boundaries.
- •Close by extending the model past Action. One line on satisfaction, repeat purchase and referral (the AIDAS or AIDAR extension) shows you know the framework's most-criticised limitation and are not just reproducing a textbook.
Test yourself
Best video explainers
The AIDA Model Explained with Examples
EPM
Clean, well-structured walkthrough of all four stages with real campaign examples — the best single starting video if you have never seen AIDA.

AIDA Model of Marketing Explained | Understand AIDA model & Marketing Funnel
The Marketing Channel - MKTG 101
Explicitly connects AIDA to the funnel shape and stage drop-offs, which is exactly how you should use it in a case.

Marketing - What is the AIDA model?
The Business Professor
Short academic explainer from a business-school lecturer — useful if you want the hierarchy-of-effects theory behind the model rather than agency-speak.

The AIDA Model (Easiest Explanation)
Helpful Professor Explains!
Very short and deliberately jargon-free — good for a fast revision pass the night before an interview.

The AIDA Model Explained | A Model for Sales and Marketing
Sales Training International
Applies AIDA to a live sales conversation rather than advertising, which helps for B2B and sales-force cases where the funnel is a rep, not an ad.
Go deeper
AIDA (marketing)
Wikipedia
The most complete free account of the model's history (Elias St. Elmo Lewis, 1898), the empirical criticism of hierarchy-of-effects models, and every major variant including AIDAS and AISDALSLove.
The AIDA Model: A Proven Framework for Converting Strangers Into Customers
HubSpot
Practitioner-grade guide with modern campaign examples and stage-by-stage tactics — closest to how you would actually apply it in a D2C or digital case.
AIDA Model — Understand the Steps in the AIDA Model Hierarchy
Corporate Finance Institute
Concise business-school framing with classic advertising examples plus a short section on the model's limitations and successors (AIDCAS, REAN, NAITDASE).
The AIDA Model and How to Apply It in the Real World
Smart Insights
The strongest source on mapping metrics to each stage and adapting AIDA to digital funnels — useful when you need to defend which KPI belongs where.
What is the AIDA Marketing Model?
TechTarget
Tight, neutral definition with the inverted-funnel visual — good for a quick, citable summary if you are writing or presenting rather than studying.
Now use it on a real case
Reading a framework isn't the same as applying it under pressure. Practise with an AI interviewer that pushes back.
Practise a case free