DuPont Analysis
Breaks ROE into margin x turnover x leverage, then splits margin again into operating, interest and tax.
On this page
The gist
- →DuPont splits ROE into an identity: Net Margin x Asset Turnover x Equity Multiplier — the three must multiply back to the stated ROE.
- →Quantify each lever's contribution by flexing one at a time; lead with the dominant lever, not a balanced summary.
- →Go five-step (operating margin x interest burden x tax burden) when debt is in the story — it separates a broken business from a broken balance sheet.
- →Judge quality, not level: leverage-driven ROE is rented from the bank. Check interest coverage and whether ROA beats the cost of debt.
The framework at a glance
When to use it
Reach for DuPont the moment a case gives you a return metric rather than an absolute profit number: "our ROE has fallen from 22 percent to 14 percent over three years, why?", "the board wants 20 percent ROE, how do we get there?", "why does our competitor earn twice our return on the same margins?", or "should we buy this company, its ROE looks great". It is the default opener for any PE or investment-banking case, any bank or NBFC case (where leverage is the business model), and any conglomerate capital-allocation case where you must rank divisions competing for the same rupee of capital. It is also the right lens when a client is about to make a structural decision that trades one lever for another: leasing versus owning real estate, outsourcing manufacturing, moving from distributor-led to company-owned retail, or offering customer credit. Do not use it when the case is about absolute profit decline (use the profitability framework instead, then bring DuPont in only if the client is judged on returns), when the company has negative equity or negative earnings (the ratio breaks), or in a pure market-entry or go-to-market case where there is no existing balance sheet to decompose.
What it is
DuPont Analysis is a way of taking one headline number, Return on Equity (ROE = Net Income / Shareholders' Equity), and pulling it apart into the three business levers that actually produce it. The identity is ROE = Net Profit Margin x Asset Turnover x Equity Multiplier, or written out: (Net Income / Revenue) x (Revenue / Total Assets) x (Total Assets / Equity). Notice that Revenue and Total Assets cancel out, so the three terms multiply straight back to Net Income / Equity. It is an accounting identity, not a theory, which is why it can never be wrong and why an interviewer can hold you to it. It was built inside the DuPont Corporation in the 1920s by an engineer who wanted management to see which part of the machine was underperforming rather than just the final output gauge.
Keep reading ↓Show less ↑
The power is that two companies can post an identical 18 percent ROE for completely different reasons. An Indian IT services firm might get there on a 20 percent net margin, 0.9x asset turnover and almost no debt. A road-building contractor might get to the same 18 percent on a 5 percent margin, 0.6x turnover and 6x leverage, meaning roughly five rupees of borrowing behind every rupee of equity. The first ROE is earned; the second is rented from the bank and disappears the moment interest rates move or a project stalls. DuPont is the tool that makes that difference visible in about ninety seconds of arithmetic. Margin answers how much you keep per rupee of sales, turnover answers how hard you sweat your asset base, and the equity multiplier answers how much of that asset base someone else paid for.
There is a deeper version, the five-step DuPont, that splits net margin into three pieces of its own: Operating Margin (EBIT / Revenue) x Interest Burden (EBT / EBIT) x Tax Burden (Net Income / EBT). This matters enormously in India, where a business can have a perfectly healthy store-level or plant-level P&L and still bleed at the bottom line because interest is eating a third of operating profit. The five-step version separates what the business does from how it is financed and taxed, so you can tell a management problem from a balance-sheet problem. If you only remember one thing: three-step tells you which lever moved, five-step tells you whether the operating engine or the capital structure is to blame.
How to apply it, step by step
- 1
Anchor on the ROE and the actual question
Write down the ROE for the years or entities in question before touching anything else. Then be explicit about which of the three questions you are answering: why did it change over time, why does it differ from a peer, or how do we raise it. The decomposition is identical but the comparison set is different, and picking the wrong one is how candidates waste four minutes. If the client is not judged on ROE at all, say so and switch frameworks.
- 2
Pull the four raw inputs and compute the three-step split
You need only Revenue, Net Income, Total Assets and Shareholders' Equity. Compute Net Margin = Net Income / Revenue, Asset Turnover = Revenue / Total Assets, Equity Multiplier = Total Assets / Equity. Use average balance-sheet figures if you have both opening and closing, but say out loud that you are simplifying to year-end if you only have one. Always multiply the three back together and confirm they reproduce the ROE. That thirty-second check catches arithmetic slips and signals rigour.
- 3
Isolate which lever actually moved
Do not just list the three ratios; quantify each one's contribution by changing one at a time and holding the others fixed. Move margin first, recompute ROE, note the point change; then move turnover; then leverage. The three deltas will sum to the total ROE change. This turns a table of numbers into a sentence like 'of the seven-point ROE drop, 5.6 points came from asset turnover'. That sentence is the answer.
- 4
Benchmark against peers and against the industry's natural shape
A 4 percent net margin is a disaster for a software firm and excellent for a supermarket. Margin and turnover trade off systematically by industry: grocery retail runs thin margins and 2x-plus turnover, branded pharma runs fat margins and low turnover, banks and NBFCs run tiny returns on assets and 5x-plus leverage by design. Compare each lever only against companies with the same shape, otherwise you will 'discover' a problem that is just the business model.
- 5
Go five-step when leverage or interest is in the story
Split net margin into Operating Margin (EBIT / Revenue) x Interest Burden (EBT / EBIT) x Tax Burden (Net Income / EBT). An interest burden below about 0.7 means interest is consuming more than 30 percent of operating profit, which is a financing problem, not an operations problem. A rising tax burden ratio may just be an expiring SEZ benefit or a shift to the new corporate tax regime, not real performance. This step separates a candidate who memorised a formula from one who can read a P&L.
- 6
Drill the weak lever into real business drivers
Ratios are not root causes. If margin fell, break it into price, mix, input cost, and fixed-cost absorption. If turnover fell, split assets into fixed assets (new plants or stores not yet at maturity, owned versus leased real estate) and working capital (inventory days, receivable days). If the multiplier rose, ask what the debt funded and whether return on assets still exceeds the after-tax cost of that debt. This is where DuPont hands off to the profitability or supply-chain framework.
- 7
Judge the quality of the ROE, not just the level
State plainly whether the return is earned or borrowed. Leverage multiplies ROE upward when ROA exceeds the after-tax cost of debt and multiplies losses downward when it does not, so a leverage-driven ROE is fragile in exactly the moment you need it. Check interest coverage (EBIT / interest) and the debt maturity wall alongside the multiplier. A 14 percent ROE at 1.5x leverage is usually worth more than a 20 percent ROE at 4x.
- 8
Convert into a ranked, quantified recommendation
Pick the one or two levers with the largest gap to benchmark and the shortest path to close, and size the prize. Working-capital release (inventory and receivable days) is normally the fastest, pricing and mix next, structural asset decisions such as sale-and-leaseback slowest. Say what ROE the fix delivers and by when. Never recommend 'add more debt' as the primary answer, even though the maths works, unless the client is explicitly under-levered relative to peers.
Worked example
Rangoli Retail is a Pune-headquartered value supermarket chain with 340 stores across Maharashtra, Gujarat and Telangana. Between FY23 and FY26 it nearly doubled revenue on the back of an aggressive expansion into tier-2 cities, buying rather than leasing most new store real estate and funding it with bank debt. Revenue is up, absolute profit is up, and yet the board is unhappy: ROE has fallen from 21 percent to 14 percent, and a large institutional investor has written in asking whether management is destroying value. The promoter asks you to explain the seven-point drop and say what to do about it.
Lay out the raw numbers
FY23: Revenue 10,000 crore, Net Income 500 crore, Total Assets 4,167 crore, Equity 2,381 crore. FY26: Revenue 16,000 crore, Net Income 640 crore, Total Assets 10,000 crore, Equity 4,571 crore. Confirm the headline first: 500/2,381 = 21.0 percent, and 640/4,571 = 14.0 percent. Absolute profit rose 28 percent while the return on shareholders' money fell by a third. That gap between growing profit and falling return is exactly the situation DuPont exists for.
Run the three-step decomposition
FY23: net margin 500/10,000 = 5.0 percent; asset turnover 10,000/4,167 = 2.4x; equity multiplier 4,167/2,381 = 1.75x. Multiply: 5.0 percent x 2.4 x 1.75 = 21.0 percent. FY26: net margin 640/16,000 = 4.0 percent; asset turnover 16,000/10,000 = 1.6x; equity multiplier 10,000/4,571 = 2.19x. Multiply: 4.0 percent x 1.6 x 2.19 = 14.0 percent. Both tie back to the stated ROE, so the arithmetic is clean and you can start interpreting.
Attribute the seven-point fall to specific levers
Change one lever at a time. Margin alone from 5.0 to 4.0 percent gives 4.0 percent x 2.4 x 1.75 = 16.8 percent, a fall of 4.2 points. Then turnover from 2.4x to 1.6x gives 4.0 percent x 1.6 x 1.75 = 11.2 percent, a further fall of 5.6 points. Then leverage from 1.75x to 2.19x brings it back to 14.0 percent, a gain of 2.8 points. Headline: asset turnover destroyed 5.6 points, margin destroyed 4.2 points, and borrowing papered over 2.8 points of the damage. Without the extra debt, ROE would be 11 percent, not 14.
Go five-step on the margin decline
FY23 EBIT was 750 crore (7.5 percent operating margin), interest 83 crore, so EBT 667 crore, and at a 25 percent tax rate net income 500 crore. Interest burden 667/750 = 0.89; tax burden 0.75. FY26 EBIT was 1,280 crore (8.0 percent operating margin), interest 427 crore, EBT 853 crore, net income 640 crore. Interest burden 853/1,280 = 0.67; tax burden still 0.75. Operating margin actually improved half a point, so private label and scale buying are working. The entire net-margin decline from 5.0 to 4.0 percent is interest: the company now hands a third of its operating profit to lenders versus a ninth three years ago.
Explain the turnover collapse in business terms
Assets grew 2.4x while revenue grew only 1.6x. Two causes. First, the decision to own rather than lease tier-2 real estate put roughly 3,500 crore of land and buildings on the balance sheet that generate no incremental sales versus a leased store. Second, stores opened in the last eighteen months are still ramping, running at perhaps 60 percent of mature-store revenue density. Sales per square foot at mature stores is flat, which confirms the problem is asset mix and store maturity, not weak demand.
Recommend against the levers, ranked by speed and size
One, sale-and-leaseback of the owned tier-2 real estate: releases roughly 3,000 crore, repays debt, lifts turnover back toward 2.1x and restores the interest burden, which together recovers most of the seven points. Two, pause new store openings for four quarters and let the existing cohort mature, which lifts turnover with zero capital. Three, protect rather than chase operating margin, since operations are not the problem. Explicitly reject adding more leverage even though it would mechanically raise ROE, because interest coverage has already fallen from 9x to 3x.
Takeaway: Rangoli's operating business got better, not worse. ROE fell because management quietly converted an asset-light retail model into an asset-heavy real-estate model funded with debt, which crushed asset turnover and handed a third of operating profit to lenders. The fix sits on the balance sheet, not in the stores, and DuPont is what tells you that in five minutes instead of five weeks.
More worked examples
Worked example: Apple's ROE tripled between FY2015 and FY2023 — did the business actually get three times better?+
You are on an investment committee looking at Apple. A junior analyst puts up one slide: Apple's return on equity was roughly 45 percent in FY2015 and roughly 155 percent in FY2023, so "the business has become three and a half times more profitable for shareholders." The committee chair is sceptical and asks you to prove or kill that claim in five minutes. All figures below are rounded from publicly reported Apple annual results and are illustrative — use them for the mechanics, not for a valuation.
ROE FY2015 (approx)
45%
ROE FY2023 (approx)
156%
Net margin FY2023 (approx)
25.3%
Asset turnover FY2023 (approx)
1.09x
Equity multiplier FY2023 (approx)
5.7x
Anchor the ROE and name the question
This is a change-over-time question, not a peer question, so the comparison set is Apple FY2015 versus Apple FY2023 and nothing else. FY2015: revenue about 234 billion dollars, net income about 53 billion, total assets about 290 billion, equity about 119 billion, so ROE is 53/119 = roughly 45 percent. FY2023: revenue about 383 billion, net income about 97 billion, total assets about 353 billion, equity about 62 billion, so ROE is 97/62 = roughly 156 percent. Note the shape of the puzzle before you decompose: revenue grew about 64 percent and net income about 83 percent over eight years, but ROE rose by 111 percentage points. Profit growth of that size cannot mathematically produce an ROE move of that size, so something in the denominator is doing the work.
Run the three-step identity for both years and tie it back
FY2015: net margin 53/234 = 22.8 percent; asset turnover 234/290 = 0.80x; equity multiplier 290/119 = 2.43x. Multiply: 0.228 x 0.80 x 2.43 = 44.3 percent, which reproduces the stated ROE. FY2023: net margin 97/383 = 25.3 percent; asset turnover 383/353 = 1.09x; equity multiplier 353/62 = 5.68x. Multiply: 0.253 x 1.09 x 5.68 = 156 percent, again a clean tie-back. Say the tie-back out loud in an interview — it takes fifteen seconds and it is the difference between quoting a formula and controlling it.
Attribute the 111-point rise, one lever at a time
Hold two levers fixed and move the third. Margin alone from 22.8 to 25.3 percent: 0.253 x 0.80 x 2.43 = 49.2 percent, so margin contributed about 4.5 points. Then turnover from 0.80x to 1.09x: 0.253 x 1.09 x 2.43 = 67.0 percent, so turnover contributed about 18 points. Then the equity multiplier from 2.43x to 5.68x takes you the rest of the way to 156 percent, contributing about 89 points. Headline sentence for the committee: roughly 80 percent of the ROE improvement came from the equity multiplier, and only about 4 points of 111 came from higher net margin. The analyst's claim that the business is three and a half times better is false as stated.
Ask why the multiplier moved — assets up or equity down?
This is the step most candidates skip, and it inverts the usual conclusion. A rising equity multiplier normally means assets grew on borrowed money, which is fragile. Here total assets rose only about 22 percent while shareholders' equity fell from about 119 billion dollars to about 62 billion, because Apple returned more cash to shareholders through buybacks and dividends than it earned — cumulative repurchases since the programme began run into the hundreds of billions, and buybacks retire equity directly. So the multiplier rose because the denominator was deliberately shrunk, not because the company loaded up on risk. Apple did also issue term debt of roughly 100 billion dollars at its peak, partly because pre-2018 much of its cash sat offshore, but that debt is comfortably inside the gross cash pile.
Go five-step on the margin and find the tax artefact
Split net margin into operating margin x interest burden x tax burden. FY2015: operating income about 71 billion on 234 billion of revenue = 30.5 percent operating margin; pre-tax income about 72 billion, so interest burden is about 1.02 (above 1.0 because Apple earns more on its investment portfolio than it pays on debt); net income 53 billion on 72 billion pre-tax = tax burden 0.74, an effective rate near 26 percent. FY2023: operating margin about 29.8 percent, interest burden about 1.0, and tax burden about 0.85 on an effective rate near 16 percent, largely reflecting the post-2018 US statutory cut from 35 to 21 percent plus mix. Read that carefully: operating margin actually drifted slightly down, and essentially the entire net-margin gain of 2.5 points is tax, not operations. Also flag that FY2024 net income carried a large one-off EU tax charge, which is exactly why you pick a clean year when comparing tax burden across time.
Benchmark honestly and judge the quality of the return
Compare Apple only against same-shape businesses, and use ROA when the multiplier is distorted: Apple's ROA is 25.3 percent x 1.09 = about 27 percent, versus a mass-market retailer like Walmart at roughly 2 to 3 percent net margin, about 2.4x turnover and about 3x leverage, giving roughly 6 percent ROA and high-teens ROE. That comparison shows Apple's operating engine is genuinely extraordinary — but that fact is visible in ROA, not in the 156 percent ROE. Also note the turnover improvement from 0.80x to 1.09x is itself half a balance-sheet story: Apple runs almost no factories, and it has been spending down its marketable-securities pile toward a net-cash-neutral target, which shrinks assets without any operational change. On risk, interest coverage is enormous (EBIT of roughly 114 billion against interest expense in the low single-digit billions), so this is a capital-return artefact, not distress leverage.
Takeaway: Kill the analyst's slide but keep the company. DuPont shows that about 89 of the 111 points of ROE improvement came from shrinking equity through buybacks, about 18 from a leaner asset base, and only about 4 from margin — and the five-step shows that even those 4 points are tax, not operations. The right conclusion is that Apple's operating quality is best measured by its roughly 27 percent ROA and 30 percent operating margin, that its ROE is not comparable across time or against peers once buybacks distort equity, and that the committee should underwrite on ROIC. The general rule to carry into any case: always ask whether the equity multiplier rose because assets grew or because equity was retired — the arithmetic is identical, the risk conclusion is opposite, and companies like Starbucks or McDonald's push this to the extreme where negative equity makes ROE meaningless altogether.
Worked example: Sarvodaya Finance, a used-CV NBFC earning 16.6 percent ROE against a peer at 19.5 percent+
A mid-market PE fund is evaluating a control stake in Sarvodaya Finance, a Coimbatore-headquartered NBFC lending against used commercial vehicles across Tamil Nadu, Karnataka and Andhra Pradesh, with an AUM of about 12,000 crore rupees. The founder's pitch is that Sarvodaya runs leaner than the listed comparable because it sources through DSAs instead of owning 900 branches. The investment committee's problem: Sarvodaya earns 16.6 percent ROE while the listed peer earns 19.5 percent on what looks like the same book. You are asked to explain the 2.9-point gap and say whether it is fixable. All figures are illustrative and expressed as a percentage of average total assets.
ROE Sarvodaya (approx)
16.6%
ROE listed peer (approx)
19.5%
ROA gap
2.4% vs 3.2%
Equity multiplier
6.9x vs 6.1x
Cost-of-funds gap
~90 bps
Recast DuPont for a lender before you compute anything
The classic three-step of margin x asset turnover x leverage breaks for a financial institution, and saying so is worth real credit. For an NBFC, assets are not a cost of doing business, they are the revenue-producing product, so revenue over assets is simply the portfolio yield, and net margin over that yield double-counts the same spread. The market-standard form is ROE = ROA x Equity Multiplier, where ROA already nets interest income, interest expense, fees, opex and credit cost. State the identity explicitly: Sarvodaya 2.4 percent x 6.9 = 16.6 percent; peer 3.2 percent x 6.1 = 19.5 percent. Both tie back, so you can start attributing.
Attribute the 2.9-point gap one lever at a time
Start from Sarvodaya at 2.4 x 6.9 = 16.6 percent. Move only ROA to the peer's 3.2 percent: 3.2 x 6.9 = 22.1 percent, a favourable swing of 5.5 points. Then move only leverage down to the peer's 6.1x: 3.2 x 6.1 = 19.5 percent, an adverse swing of 2.6 points. The two deltas net to the 2.9-point gap, and the sentence that matters is this: Sarvodaya's underlying earning power is 5.5 points of ROE worse than the peer's, and it is currently hiding roughly 2.6 points of that hole by running about 13 percent more leverage. The founder's lean-cost story is not visible in the headline ROE gap because leverage is masking the real spread.
Drill ROA into its five component spreads
Break ROA into yield, cost of funds, fees, opex and credit cost, all as a percentage of average assets, and pre-tax. Sarvodaya: yield 15.0, funding cost 7.8, so NIM 7.2; fees 0.5; opex 3.6; credit cost 0.9; PBT 3.2; at a 25 percent tax rate, ROA 2.4. Peer: yield 15.8, funding cost 6.9, so NIM 8.9; fees 0.6; opex 4.3; credit cost 0.9; PBT 4.3; ROA 3.2. So the founder is right about opex — Sarvodaya is 70 bps cheaper to run — but that saving is swamped by 90 bps of worse funding cost and 80 bps of lower yield.
Convert the two spread gaps into business causes
On funding, Sarvodaya is rated A+ against the peer's AA+, and roughly 68 percent of its borrowings are bank term loans priced off MCLR, with no NCD programme, no securitisation or direct-assignment desk, and no public deposit licence — that mix, not negotiating skill, is the 90 bps. On yield, about 40 percent of the book is refinance and top-up lending to existing customers, written at 200 to 300 bps below fresh used-vehicle rates to stop attrition, and the fleet mix skews to 4-to-6-year-old vehicles rather than the 8-plus-year-old, small-operator segment where the peer prices highest. The DSA-led sourcing that produces the opex saving is itself the reason yields are thin: a third-party sourcer competes on rate, an owned branch competes on relationship and turnaround time. Flag one more thing to the committee — identical 0.9 percent credit cost with a materially DSA-sourced book is suspicious, because DSA vintages typically season worse, so ask for static-pool loss curves by sourcing channel before believing it.
Judge the quality of the leverage, not just its level
A 6.9x equity multiplier means equity is about 14.5 percent of assets, which for an NBFC sits uncomfortably close to the regulatory CRAR floor of 15 percent — so there is almost no headroom to grow the book without fresh equity, and any ROE built on that leverage is not repeatable at scale. The asset-liability profile compounds the fragility: floating-rate bank borrowings against a fixed-rate loan book means a repo-hiking cycle widens the funding gap immediately while the book reprices only as it runs off. The reference case for an Indian audience is the 2018-19 IL&FS and DHFL sequence, where wholesale-funded NBFCs with thin equity and short liabilities lost access to funding in weeks. Conclusion for this lever: Sarvodaya's leverage is not a strength to be extended, it is a liability to be reduced.
Rank the fixes by size and time to close
One, fix the liability side first — build an NCD programme, start co-lending with a bank under the 80:20 structure, and run direct assignment on the seasoned book; co-lending is doubly useful because it moves 80 percent of new loans off balance sheet while retaining servicing fee income, which lifts ROA and cuts the multiplier at the same time. A 50 bps funding-cost improvement is worth roughly 37 bps of pre-tax and about 28 bps of post-tax ROA, which at 6.9x is roughly 1.9 points of ROE, achievable in 12 to 18 months. Two, reprice or shrink the low-yield top-up book and push DSA sourcing toward the older-vehicle, higher-yield segment, worth perhaps 30 to 40 bps of yield and another 1.5 to 2 points of ROE, but over 24 months as the book turns. Three, explicitly reject the tempting arithmetic answer of levering to 7.5x, because it adds about 1.8 points of ROE while eating the entire regulatory buffer.
Takeaway: Recommend proceeding, but underwrite the deal on ROA, not on ROE. DuPont shows that Sarvodaya's 16.6 percent ROE is a 2.4 percent ROA business wearing 6.9x leverage, while the peer's 19.5 percent is a genuinely stronger 3.2 percent ROA business wearing less. The entire gap is a liability-side and pricing problem rather than a cost problem, which is good news for a PE buyer because rating, funding mix and co-lending are exactly the things a credible sponsor and a professional CFO can fix inside two years — whereas a branch network cannot be built that fast. Price the entry off today's 2.4 percent ROA, hold the leverage flat as a covenant, and make the exit case the move to a 3.0 percent-plus ROA; the one thing the fund must not do is accept ROE improvement that arrives through the equity multiplier.
Common pitfalls
- •Reciting the three ratios as a list and stopping there. Naming that margin, turnover and leverage exist is not analysis. You must quantify how many points of the ROE change each lever contributed by flexing one at a time, then name the business reason behind the weak one. Interviewers hear the recitation constantly and it reads as memorisation.
- •Treating a rising equity multiplier as good news. Leverage mechanically raises ROE whenever ROA exceeds the after-tax cost of debt, so a company can manufacture a beautiful ROE by borrowing while the underlying business stagnates. Always check interest coverage and whether the operating engine is actually improving before you celebrate.
- •Benchmarking a ratio against the wrong industry. A 2 percent net margin is normal for grocery retail and catastrophic for branded pharma; a 5x equity multiplier is a disaster for a manufacturer and simply how a bank or NBFC works. Margin and turnover trade off by business model, so compare each lever only against genuine peers.
- •Mixing an income-statement flow with a point-in-time balance-sheet figure without saying so. Revenue and net income are full-year flows while total assets and equity are snapshots, so use averages of opening and closing balances where you can. If a company raised equity or made a large acquisition mid-year, year-end figures will badly distort turnover and the multiplier.
- •Applying DuPont to a company with negative equity, negative earnings, or heavy off-balance-sheet leasing. Negative equity makes ROE meaningless or perversely positive. Lease treatment changes asset intensity, so a leased-store retailer and an owned-store retailer are not comparable on turnover without adjusting for it first.
- •Forgetting that ROE is a shareholder metric, not a management-performance metric. Divisional managers do not control capital structure, so judging a business unit on ROE punishes it for the parent's financing choices. Use ROIC or ROCE for operating comparisons and reserve ROE for the equity-holder question.
Interview tips
- •Ask for the four inputs explicitly and early: revenue, net income, total assets, shareholders' equity. Four numbers buy you the entire decomposition. If the interviewer gives you only ROE and one other ratio, you can still back out the third algebraically, and doing that out loud is a strong signal.
- •Always multiply the three components back and confirm they equal the stated ROE before you interpret anything. It takes ten seconds, catches slips, and shows the interviewer you understand this is an identity rather than an estimate.
- •Lead your synthesis with the single dominant lever, not a balanced summary. 'Of the seven-point ROE decline, 5.6 points came from asset turnover collapsing as we bought real estate' beats 'margins fell somewhat, turnover fell, and leverage rose' every time. Rank first, then explain.
- •Escalate to the five-step version the moment interest or debt enters the conversation. Separating operating margin from interest burden and tax burden lets you say whether the business or the balance sheet is broken, which is usually the answer the interviewer is fishing for.
- •Know the shapes of the major Indian sectors cold so you can sanity-check numbers live: value retail is thin margin and high turnover, IT services is high margin and asset-light with almost no leverage, cement and infrastructure are asset-heavy with moderate margins, NBFCs and banks earn 1 to 2 percent on assets and rely on 5x-plus leverage by design.
- •Close on quality, not level. State whether the ROE is earned through operations or borrowed through leverage, and what happens to it if rates rise 200 basis points or volumes fall 15 percent. That one sentence separates a finance-literate candidate from a formula-literate one.
Test yourself
Best video explainers
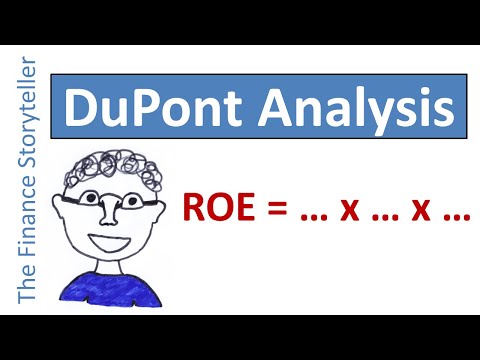
DuPont analysis explained
The Finance Storyteller
The cleanest first watch: builds the ROE, ROA and return-on-sales relationship from scratch and shows visually why the terms cancel, so the identity stops feeling like magic.

DuPont analysis example ROE
The Finance Storyteller
Applies the decomposition to a real listed company's published annual results, which is the fastest way to see where each input actually sits on the income statement and balance sheet.

Dupont Formula Explained In 2 Minutes
Ryan O'Connell, CFA, FRM
A two-minute refresher from a CFA charterholder, ideal for revising the formula and the three-versus-five-step distinction the night before an interview.

Comprehensive Guide to DuPont Analysis and ROE
Michael S Glaspie
A longer 2024 walkthrough for when you want the full derivation and the five-step extension covered slowly rather than in summary form.
Go deeper
DuPont Analysis
Corporate Finance Institute
The standard free reference for both the three-step and five-step models, with a clear explanation of why margin and asset turnover trade off across industries.
DuPont Analysis: Formula and Ratio Calculator
Wall Street Prep
Gives the exact five-step formula with tax burden, interest burden and operating margin defined precisely, plus a downloadable model you can rebuild yourself in Excel.
DuPont Analysis and ROE Decomposition (CFA Level 1)
AnalystPrep
The CFA curriculum treatment, the most rigorous free version, and it matches how finance interviewers at banks and PE firms were themselves taught the model.
What is DuPont Analysis? A Complete Guide for Indian Investors
PL Capital
Frames the framework with Indian sector examples and rupee figures, including a side-by-side of an IT firm and an infrastructure firm reaching identical ROE by opposite routes.
DuPont analysis
Wikipedia
Concise history of the model's origin inside DuPont Corporation in the 1920s and the algebra showing why the decomposition is an identity rather than an approximation.
Now use it on a real case
Reading a framework isn't the same as applying it under pressure. Practise with an AI interviewer that pushes back.
Practise a case free